HP StorageWorks 1606 Brocade Web Tools Administrator's Guide v6.3.0 (53-100134 - Page 227
Fabric Watch alarm information, Viewing an alarm configuration report, Displaying alarms
 |
View all HP StorageWorks 1606 manuals
Add to My Manuals
Save this manual to your list of manuals |
Page 227 highlights
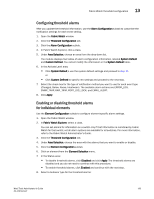
Fabric Watch alarm information 13 Fabric Watch alarm information From Fabric Watch, you can view two types of reports: • Alarm notifications-Displays the alarms that occurred for a selected class or area. • Alarm configuration-Displays threshold and alarm configurations for a selected class or area. Viewing an alarm configuration report Use the Threshold Configuration tab, Configuration Report subtab to display a report of the configuration for a selected class or area with the following information: • Threshold settings (labeled Threshold Configuration) • Notification settings (labeled Action Configuration) • Element settings (not labeled) You can scroll through this information, but cannot make changes. Use the following procedure to view an alarm configuration report. 1. Open the Fabric Watch window. 2. Click the Threshold Configuration tab. 3. Click a previously configured element from Fabric Watch Explorer (for instructions, refer to "Enabling or disabling threshold alarms for individual elements" on page 193). 4. Under Area Selection, click the alarm area report to be viewed. 5. Click the Configuration Report subtab. This tab displays a report of the configuration for the selected area. Displaying alarms Using the Alarm Notification tab, you can view a list of all alarms that occurred for a selected class or area (Figure 102 on page 190). Table 15 describes the columns in this report. You can click the header of each column to change the way the information is sorted in your view. You can also right-click the column header and choose sort options from a menu. NOTE Note that for the FRU class, only the Name, State, and Time columns are displayed. In addition, if the FRU area is Fan, the Name column refers to either a fan or a fan FRU, depending on the switch model. Refer to "Viewing detailed fan hardware status" on page 158 for more information. TABLE 15 Field Alarm notification table fields Description Name State Reason Last Value The string assigned to the element that had an event The current state of the element The event type that was triggered The data value of the element when the event was triggered Web Tools Administrator's Guide 195 53-1001343-01
-
 1
1 -
2
-
3
-
4
-
5
-
6
-
7
-
8
-
9
-
10
-
11
-
12
-
13
-
14
-
15
-
16
-
17
-
18
-
19
-
20
-
21
-
22
-
23
-
24
-
25
-
26
-
27
-
28
-
29
-
30
-
31
-
32
-
33
-
34
-
35
-
36
-
37
-
38
-
39
-
40
-
41
-
42
-
43
-
44
-
45
-
46
-
47
-
48
-
49
-
50
-
51
-
52
-
53
-
54
-
55
-
56
-
57
-
58
-
59
-
60
-
61
-
62
-
63
-
64
-
65
-
66
-
67
-
68
-
69
-
70
-
71
-
72
-
73
-
74
-
75
-
76
-
77
-
78
-
79
-
80
-
81
-
82
-
83
-
84
-
85
-
86
-
87
-
88
-
89
-
90
-
91
-
92
-
93
-
94
-
95
-
96
-
97
-
98
-
99
-
100
-
101
-
102
-
103
-
104
-
105
-
106
-
107
-
108
-
109
-
110
-
111
-
112
-
113
-
114
-
115
-
116
-
117
-
118
-
119
-
120
-
121
-
122
-
123
-
124
-
125
-
126
-
127
-
128
-
129
-
130
-
131
-
132
-
133
-
134
-
135
-
136
-
137
-
138
-
139
-
140
-
141
-
142
-
143
-
144
-
145
-
146
-
147
-
148
-
149
-
150
-
151
-
152
-
153
-
154
-
155
-
156
-
157
-
158
-
159
-
160
-
161
-
162
-
163
-
164
-
165
-
166
-
167
-
168
-
169
-
170
-
171
-
172
-
173
-
174
-
175
-
176
-
177
-
178
-
179
-
180
-
181
-
182
-
183
-
184
-
185
-
186
-
187
-
188
-
189
-
190
-
191
-
192
-
193
-
194
-
195
-
196
-
197
-
198
-
199
-
200
-
201
-
202
-
203
-
204
-
205
-
206
-
207
-
208
-
209
-
210
-
211
-
212
-
213
-
214
-
215
-
216
-
217
-
218
-
219
-
220
-
221
-
 222
222 -
 223
223 -
 224
224 -
 225
225 -
 226
226 -
 227
227 -
 228
228 -
 229
229 -
 230
230 -
 231
231 -
 232
232 -
233
-
234
-
235
-
236
-
237
-
238
-
239
-
240
-
241
-
242
-
243
-
244
-
245
-
246
-
247
-
248
-
249
-
250
-
251
-
252
-
253
-
254
-
255
-
256
-
257
-
258
-
259
-
260
-
261
-
262
-
263
-
264
-
265
-
266
-
267
-
268
-
269
-
270
-
271
-
272
-
273
-
274
-
275
-
276
-
277
-
278
-
279
-
280
-
281
-
282
-
283
-
284
-
285
-
286
-
287
-
288
-
289
-
290
-
291
-
292
-
293
-
294
-
295
-
296
-
297
-
298
-
299
-
300
-
301
-
302
-
303
-
304
-
305
-
306
-
307
-
308
-
309
-
310
-
311
-
312
-
313
-
314
-
315
-
316
-
317
-
318
-
319
-
320
-
321
-
322
-
323
-
324
-
325
-
326
-
327
-
328
-
329
-
330
-
331
-
332
-
333
-
334
-
335
-
336
-
337
-
338
-
339
-
340
-
341
-
342
-
343
-
344
-
345
-
346
-
347
-
348
-
349
-
350
-
351
-
352
-
353
-
354
-
355
-
356
-
357
-
358
-
359
-
360
-
361
-
362
-
363
-
364
-
365
-
366
-
367
-
368
-
369
-
370
 |
 |
