HP StorageWorks 1606 Brocade Web Tools Administrator's Guide v6.3.0 (53-100134 - Page 162
Tunnel and TCP performance monitoring graphs
 |
View all HP StorageWorks 1606 manuals
Add to My Manuals
Save this manual to your list of manuals |
Page 162 highlights
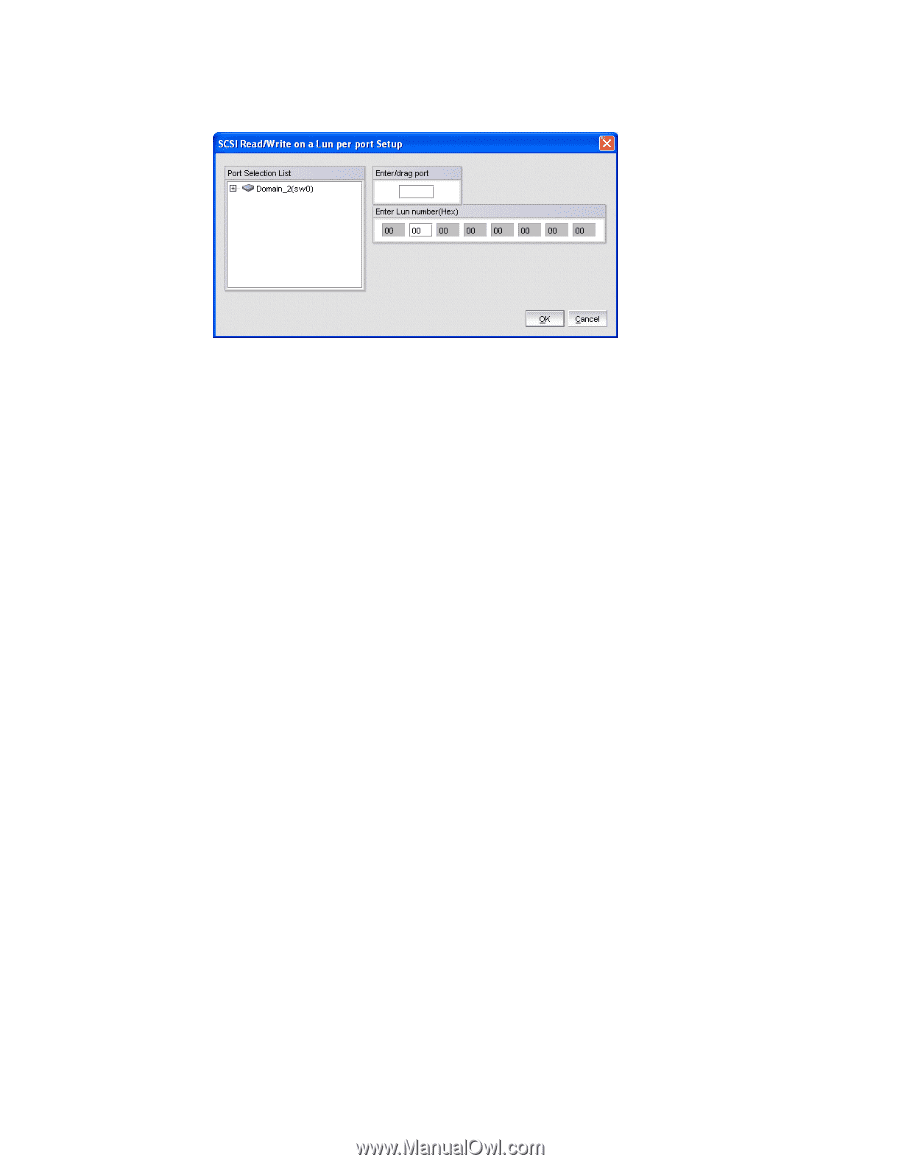
8 Tunnel and TCP performance monitoring graphs FIGURE 71 Creating a SCSI command graph 3. Navigate to a switch > slot > port in the Port Selection List. 4. Click the port from the Port Selection List and drag it into the Enter/drag port field. 5. Optional: For the LUN per port graphs, type a LUN number, in hexadecimal notation. For the Brocade Encryption Switch you can enter up to eight LUN masks For the Brocade 5100, 5300, 300, 7500, 7800, and 8000 you can enter up to eight LUN masks For the Brocade 4100 or 5000 Switch, you can enter up to eight LUN masks. For the Brocade 48000 director, you can enter up to four LUN masks. For all other switches running Fabric OS 4.x or v5.x, you can enter up to two LUN masks. For switches running Fabric OS 3.x, you can enter up to three LUN masks. 6. Click OK. The selected graph is displayed in the canvas. Tunnel and TCP performance monitoring graphs This section describes how to generate the Tunnel and TCP performance monitor graphs. You can launch maximum of four Tunnel and TCP graphs for a switch at a time. A total of 16 TCP connection graphs can only be launched for a switch. For TCP connection graphs, tool tip is displayed only for a single connection, whichever is selected first. 1. Open the Performance Monitoring window. 2. Click Performance Graphs > Tunnel and TCP Graph. The Tunnel and TCP Graph dialog box displays (Figure 72 on page 131). The first three charts display the Tunnel level statistics and the other eight charts display the TCP level statistics. 130 Web Tools Administrator's Guide 53-1001343-01
-
 1
1 -
2
-
3
-
4
-
5
-
6
-
7
-
8
-
9
-
10
-
11
-
12
-
13
-
14
-
15
-
16
-
17
-
18
-
19
-
20
-
21
-
22
-
23
-
24
-
25
-
26
-
27
-
28
-
29
-
30
-
31
-
32
-
33
-
34
-
35
-
36
-
37
-
38
-
39
-
40
-
41
-
42
-
43
-
44
-
45
-
46
-
47
-
48
-
49
-
50
-
51
-
52
-
53
-
54
-
55
-
56
-
57
-
58
-
59
-
60
-
61
-
62
-
63
-
64
-
65
-
66
-
67
-
68
-
69
-
70
-
71
-
72
-
73
-
74
-
75
-
76
-
77
-
78
-
79
-
80
-
81
-
82
-
83
-
84
-
85
-
86
-
87
-
88
-
89
-
90
-
91
-
92
-
93
-
94
-
95
-
96
-
97
-
98
-
99
-
100
-
101
-
102
-
103
-
104
-
105
-
106
-
107
-
108
-
109
-
110
-
111
-
112
-
113
-
114
-
115
-
116
-
117
-
118
-
119
-
120
-
121
-
122
-
123
-
124
-
125
-
126
-
127
-
128
-
129
-
130
-
131
-
132
-
133
-
134
-
135
-
136
-
137
-
138
-
139
-
140
-
141
-
142
-
143
-
144
-
145
-
146
-
147
-
148
-
149
-
150
-
151
-
152
-
153
-
154
-
155
-
156
-
 157
157 -
 158
158 -
 159
159 -
 160
160 -
 161
161 -
 162
162 -
 163
163 -
 164
164 -
 165
165 -
 166
166 -
 167
167 -
168
-
169
-
170
-
171
-
172
-
173
-
174
-
175
-
176
-
177
-
178
-
179
-
180
-
181
-
182
-
183
-
184
-
185
-
186
-
187
-
188
-
189
-
190
-
191
-
192
-
193
-
194
-
195
-
196
-
197
-
198
-
199
-
200
-
201
-
202
-
203
-
204
-
205
-
206
-
207
-
208
-
209
-
210
-
211
-
212
-
213
-
214
-
215
-
216
-
217
-
218
-
219
-
220
-
221
-
222
-
223
-
224
-
225
-
226
-
227
-
228
-
229
-
230
-
231
-
232
-
233
-
234
-
235
-
236
-
237
-
238
-
239
-
240
-
241
-
242
-
243
-
244
-
245
-
246
-
247
-
248
-
249
-
250
-
251
-
252
-
253
-
254
-
255
-
256
-
257
-
258
-
259
-
260
-
261
-
262
-
263
-
264
-
265
-
266
-
267
-
268
-
269
-
270
-
271
-
272
-
273
-
274
-
275
-
276
-
277
-
278
-
279
-
280
-
281
-
282
-
283
-
284
-
285
-
286
-
287
-
288
-
289
-
290
-
291
-
292
-
293
-
294
-
295
-
296
-
297
-
298
-
299
-
300
-
301
-
302
-
303
-
304
-
305
-
306
-
307
-
308
-
309
-
310
-
311
-
312
-
313
-
314
-
315
-
316
-
317
-
318
-
319
-
320
-
321
-
322
-
323
-
324
-
325
-
326
-
327
-
328
-
329
-
330
-
331
-
332
-
333
-
334
-
335
-
336
-
337
-
338
-
339
-
340
-
341
-
342
-
343
-
344
-
345
-
346
-
347
-
348
-
349
-
350
-
351
-
352
-
353
-
354
-
355
-
356
-
357
-
358
-
359
-
360
-
361
-
362
-
363
-
364
-
365
-
366
-
367
-
368
-
369
-
370
 |
 |