Samsung SCX 4828FN SyncThru 5.0 Guide (ENGLISH) - Page 61
Analysis & Report categories
 |
UPC - 635753612172
View all Samsung SCX 4828FN manuals
Add to My Manuals
Save this manual to your list of manuals |
Page 61 highlights
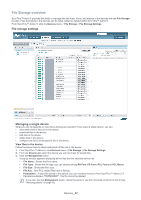
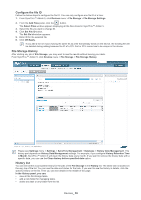
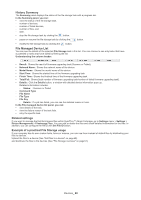
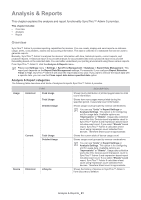
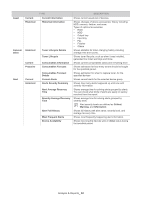
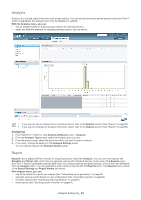
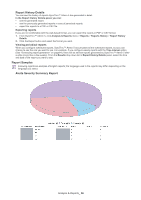
Analysis & Reports 5. This chapter explains the analysis and report functionality SyncThru™ Admin 5 provides. This chapter includes: • Overview • Analysis • Report Overview SyncThru™ Admin 5 provides reporting capabilities for devices. You can create, display and send reports on statuses, usage, alerts, consumables, assets and accounting information. The data is collected in a database that can be used to generate reports. Basically, SyncThru™ Admin 5 analyzes the devices' information with time, historical reports, current reports, and proactive reports. A historical report is to provide analysis for accumulated data and a proactive report is to provide forecasting based on the collected data. You can better understand your printing environment using these various reports. From SyncThru™ Admin 5, click the Analysis & Reports menu. Please see Settings menu > Settings > SyncThru Management > Database > Report Data Management. This report part depends on the Report Data Management settings. For example, if you configure Report Retention Times to Year, SyncThru™ Admin 5 will clean the report data every year. If you want to remove the report data with a specific date, you can use the Clean report data before specified date option. Analysis & Report categories The following table describes what kinds of analyses & reports SyncThru™ Admin 5 provides. Usage Historical TYPE Peak Usage Total Usage Detailed Usage Current Total Usage Detailed Usage Device Historical Lifecycle DESCRIPTION Shows hourly distribution of printed pages based on total count information. Shows how many pages were printed during the specified period. It uses total count information. Shows usage count grouped by various combinations. You can see "Units" in Report Settings or Analysis Settings. This option is for configuring unit for usage data. Available options are "Impressions" or "Sheets". Usage data collection works like this: Devices send impression count to SyncThru™ Admin 5 and impression based report includes exact count. If you select "Sheets" based report, SyncThru™ Admin 5 calculates sheet count using impression count collected from devices. Therefore Sheet count is approximate. Shows the current state of device usage count. Shows usage count grouped by various combinations. You can see "Units" in Report Settings or Analysis Settings. This option is for configuring unit for usage data. Available options are "Impressions" or "Sheets". Usage data collection works like this: Devices send impression count to SyncThru™ Admin 5 and impression based report includes exact count. If you select "Sheets" based report, SyncThru™ Admin 5 calculates sheet count using impression count collected from devices. Therefore Sheet count is approximate. Shows the history of devices in SyncThru™ Admin 5 from discovery to deletion. Analysis & Reports_ 61
-
 1
1 -
2
-
3
-
4
-
5
-
6
-
7
-
8
-
9
-
10
-
11
-
12
-
13
-
14
-
15
-
16
-
17
-
18
-
19
-
20
-
21
-
22
-
23
-
24
-
25
-
26
-
27
-
28
-
29
-
30
-
31
-
32
-
33
-
34
-
35
-
36
-
37
-
38
-
39
-
40
-
41
-
42
-
43
-
44
-
45
-
46
-
47
-
48
-
49
-
50
-
51
-
52
-
53
-
54
-
55
-
 56
56 -
 57
57 -
 58
58 -
 59
59 -
 60
60 -
 61
61 -
 62
62 -
 63
63 -
 64
64 -
 65
65 -
 66
66 -
67
-
68
-
69
-
70
-
71
-
72
-
73
-
74
-
75
-
76
-
77
-
78
-
79
-
80
-
81
-
82
-
83
-
84
-
85
-
86
-
87
-
88
-
89
-
90
-
91
-
92
-
93
-
94
-
95
-
96
-
97
-
98
-
99
-
100
-
101
-
102
-
103
-
104
-
105
-
106
-
107
-
108
-
109
-
110
-
111
 |
 |