Epson LQ-1000 User Manual - Page 85
Using Hand-calculated Data to Print Graphics, The actual pattern that the LQ prints on the paper is
 |
View all Epson LQ-1000 manuals
Add to My Manuals
Save this manual to your list of manuals |
Page 85 highlights
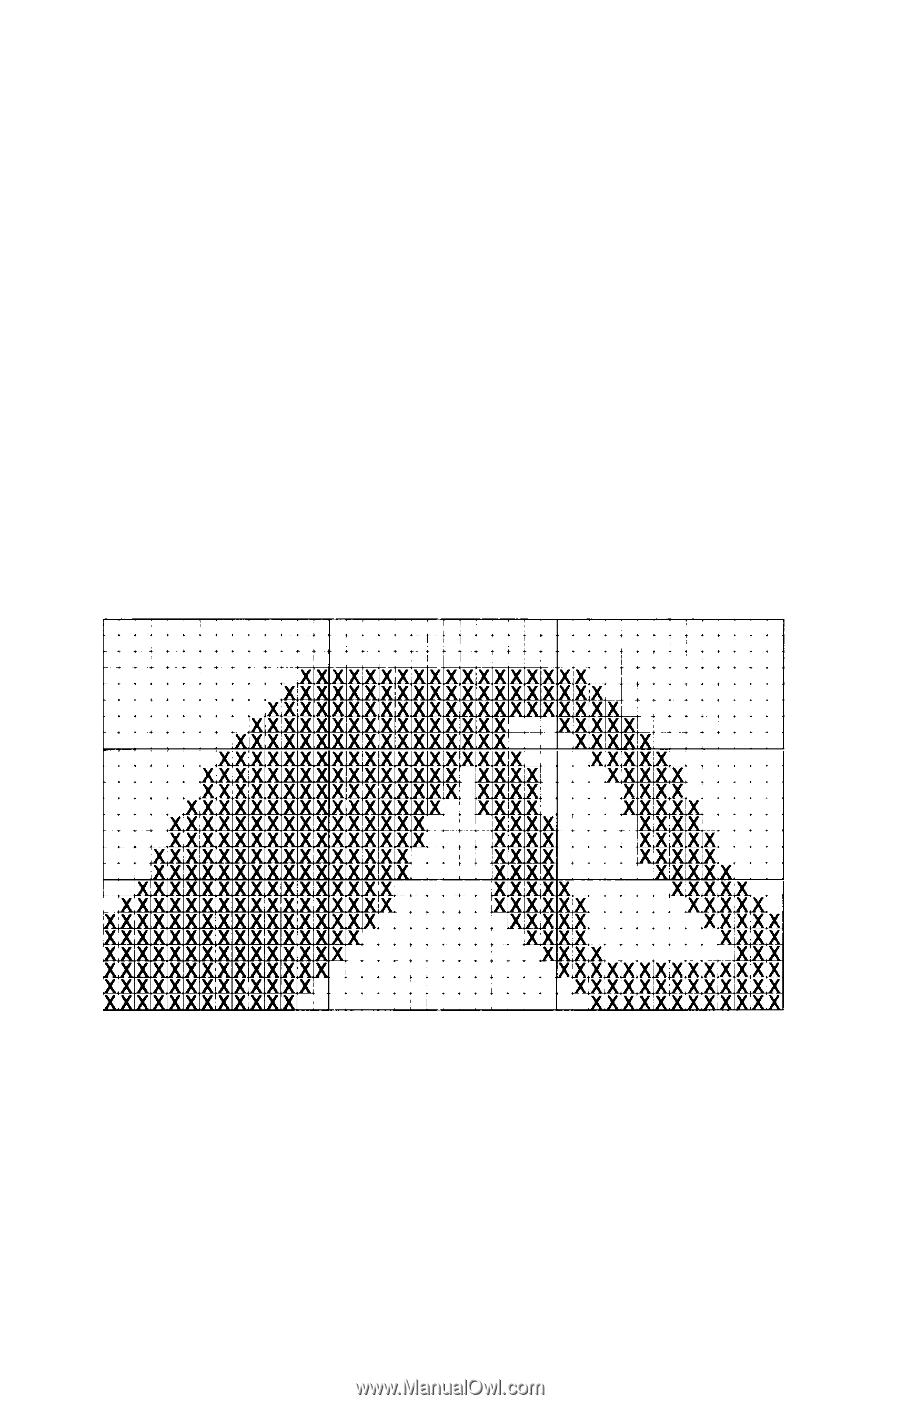
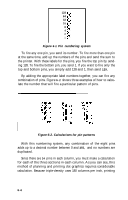
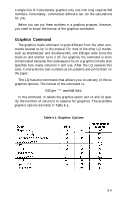
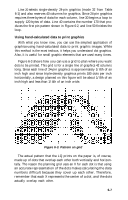
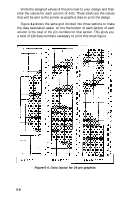
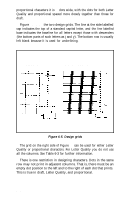
Line 20 selects single-density 24-pin graphics (mode 32 from Table 6-1) and also reserves 40 columns for graphics. Since 24-pin graphics requires three bytes of data for each column, line 30 begins a loop to supply 120 bytes of data. Line 40 contains the number 170 that produces the first pin pattern shown in Figure 6-2, and line 50 finishes the loop. Using hand-calculated data to print graphics With what you know now, you can use the simplest application of graphics-using hand-calculated data to print graphic images. While this method is the most tedious, it helps you understand dot graphics. Also, it is useful for small graphic elements that are used many times. Figure 6-3 shows how you can use a grid to plan where you want dots to be printed. This grid is for a single line of graphics 42 columns long. Since each line of 24-pin graphics is approximately 1/8th of an inch high and since triple-density graphics prints 180 dots per inch horizontally, a design planned on this figure will be about 1/8th of an inch high and less than 1/4th of an inch wide. Figure 6-3. Pattern on grid The actual pattern that the LQ prints on the paper is, of course, made up of dots that overlap each other both vertically and horizontally. The reason the planning grid uses an X for each dot is that using an accurate representation of the dots makes calculating the data numbers difficult because they cover up each other. Therefore, remember that each X represents the center of a dot, and the dots actually overlap each other. 6-7
-
 1
1 -
2
-
3
-
4
-
5
-
6
-
7
-
8
-
9
-
10
-
11
-
12
-
13
-
14
-
15
-
16
-
17
-
18
-
19
-
20
-
21
-
22
-
23
-
24
-
25
-
26
-
27
-
28
-
29
-
30
-
31
-
32
-
33
-
34
-
35
-
36
-
37
-
38
-
39
-
40
-
41
-
42
-
43
-
44
-
45
-
46
-
47
-
48
-
49
-
50
-
51
-
52
-
53
-
54
-
55
-
56
-
57
-
58
-
59
-
60
-
61
-
62
-
63
-
64
-
65
-
66
-
67
-
68
-
69
-
70
-
71
-
72
-
73
-
74
-
75
-
76
-
77
-
78
-
79
-
 80
80 -
 81
81 -
 82
82 -
 83
83 -
 84
84 -
 85
85 -
 86
86 -
 87
87 -
 88
88 -
 89
89 -
 90
90 -
91
-
92
-
93
-
94
-
95
-
96
-
97
-
98
-
99
-
100
-
101
-
102
-
103
-
104
-
105
-
106
-
107
-
108
-
109
-
110
-
111
-
112
-
113
-
114
-
115
-
116
-
117
-
118
-
119
-
120
-
121
-
122
-
123
-
124
-
125
-
126
-
127
-
128
-
129
-
130
-
131
-
132
-
133
-
134
-
135
-
136
-
137
-
138
-
139
-
140
-
141
-
142
-
143
-
144
-
145
-
146
-
147
-
148
-
149
-
150
-
151
-
152
-
153
-
154
-
155
-
156
-
157
-
158
-
159
-
160
-
161
-
162
-
163
-
164
-
165
-
166
-
167
-
168
-
169
-
170
-
171
-
172
-
173
-
174
-
175
-
176
-
177
-
178
-
179
-
180
-
181
-
182
-
183
-
184
-
185
 |
 |