HP GbE2c HP GbE2c Ethernet Blade Switch for c-Class BladeSystem Application Gu - Page 163
Trace route, Statistics and state information, Customer support tools - command reference guide
 |
UPC - 808736802215
View all HP GbE2c manuals
Add to My Manuals
Save this manual to your list of manuals |
Page 163 highlights
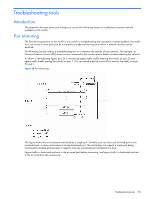
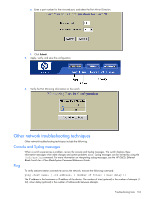
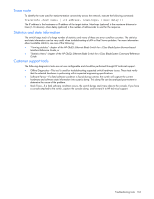
Trace route To identify the route used for station-to-station connectivity across the network, execute the following command: traceroute | [ [ msec delay ]] The IP address is the hostname or IP address of the target station. Max-hops (optional) is the maximum distance to trace (1-16 devices). Msec delay (optional) is the number of milliseconds to wait for the response. Statistics and state information The switch keeps track of a large number of statistics and many of these are error condition counters. The statistics and state information can be very useful when troubleshooting a LAN or Real Server problem. For more information about available statistics, see one of the following: • "Viewing statistics" chapter of the HP GbE2c Ethernet Blade Switch for c-Class BladeSystem Browser-based Interface Reference Guide, or • "Statistics Menu" chapter of the HP GbE2c Ethernet Blade Switch for c-Class BladeSystem Command Reference Guide Customer support tools The following diagnostics tools are not user-configurable and should be performed through HP technical support. • Offline Diagnostics-This tool is used for troubleshooting suspected switch hardware issues. These tests verify that the selected hardware is performing within expected engineering specifications. • Software Panics-If a fatal software condition is found during runtime, the switch will capture the current hardware and software state information into a panic dump. This dump file can be analyzed post-mortem to determine the cause of the problem. • Stack Trace-If a fatal software condition occurs, the switch dumps stack trace data to the console. If you have a console attached to the switch, capture the console dump, and forward it to HP technical support. Troubleshooting tools 163
-
 1
1 -
2
-
3
-
4
-
5
-
6
-
7
-
8
-
9
-
10
-
11
-
12
-
13
-
14
-
15
-
16
-
17
-
18
-
19
-
20
-
21
-
22
-
23
-
24
-
25
-
26
-
27
-
28
-
29
-
30
-
31
-
32
-
33
-
34
-
35
-
36
-
37
-
38
-
39
-
40
-
41
-
42
-
43
-
44
-
45
-
46
-
47
-
48
-
49
-
50
-
51
-
52
-
53
-
54
-
55
-
56
-
57
-
58
-
59
-
60
-
61
-
62
-
63
-
64
-
65
-
66
-
67
-
68
-
69
-
70
-
71
-
72
-
73
-
74
-
75
-
76
-
77
-
78
-
79
-
80
-
81
-
82
-
83
-
84
-
85
-
86
-
87
-
88
-
89
-
90
-
91
-
92
-
93
-
94
-
95
-
96
-
97
-
98
-
99
-
100
-
101
-
102
-
103
-
104
-
105
-
106
-
107
-
108
-
109
-
110
-
111
-
112
-
113
-
114
-
115
-
116
-
117
-
118
-
119
-
120
-
121
-
122
-
123
-
124
-
125
-
126
-
127
-
128
-
129
-
130
-
131
-
132
-
133
-
134
-
135
-
136
-
137
-
138
-
139
-
140
-
141
-
142
-
143
-
144
-
145
-
146
-
147
-
148
-
149
-
150
-
151
-
152
-
153
-
154
-
155
-
156
-
157
-
 158
158 -
 159
159 -
 160
160 -
 161
161 -
 162
162 -
 163
163 -
 164
164 -
 165
165
 |
 |