HP Surestore 64 fw 05.01.00 and sw 07.01.00 - Director Product Manager - User - Page 106
Bar Graph Display, Port Statistics
 |
View all HP Surestore 64 manuals
Add to My Manuals
Save this manual to your list of manuals |
Page 106 highlights
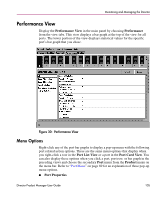
Monitoring and Managing the Director ■ Node Properties ■ Port Technology ■ Block Port ■ Enable Beaconing ■ Port Diagnostics ■ Channel Wrap (FICON Management Style only) ■ Swap Ports (FICON Management Style only) ■ Clear Link Incident Alerts ■ Reset Port ■ Port Binding ■ Clear Threshold Alerts Note: For Node Properties, if a node is not logged in, a message displays indicating that node information is not available. Bar Graph Display The Performance View provides a graphical display of performance for all ports. Each bar graph in the upper portion of the view panel displays the level of transmit/receive activity for the port. This information updates every five seconds. Each bar graph shows the percentage of link utilization for the port. A red arrow marks the highest utilization since the opening of the Performance View. If the system detects activity on a port, it represents minimal activity with one bar. When a port is logged in, moving the cursor over its bar graph displays a message with the attached port's WWN. If the port is an E_Port, the message reads E_Port and if the port is not logged in, the message displays the port's current operational state (refer to Table 4). Port Statistics To choose and display more detailed performance information for a port, click the port's bar graph. The bar graph for that port highlights with a darker background, and the lower portion of the Performance View panel displays the statistics values for the port's number and the WWN decoding. The Statistics Values tables contain cumulative port statistics and error statistics for transmit and 106 Director Product Manager User Guide
-
 1
1 -
2
-
3
-
4
-
5
-
6
-
7
-
8
-
9
-
10
-
11
-
12
-
13
-
14
-
15
-
16
-
17
-
18
-
19
-
20
-
21
-
22
-
23
-
24
-
25
-
26
-
27
-
28
-
29
-
30
-
31
-
32
-
33
-
34
-
35
-
36
-
37
-
38
-
39
-
40
-
41
-
42
-
43
-
44
-
45
-
46
-
47
-
48
-
49
-
50
-
51
-
52
-
53
-
54
-
55
-
56
-
57
-
58
-
59
-
60
-
61
-
62
-
63
-
64
-
65
-
66
-
67
-
68
-
69
-
70
-
71
-
72
-
73
-
74
-
75
-
76
-
77
-
78
-
79
-
80
-
81
-
82
-
83
-
84
-
85
-
86
-
87
-
88
-
89
-
90
-
91
-
92
-
93
-
94
-
95
-
96
-
97
-
98
-
99
-
100
-
 101
101 -
 102
102 -
 103
103 -
 104
104 -
 105
105 -
 106
106 -
 107
107 -
 108
108 -
 109
109 -
 110
110 -
 111
111 -
112
-
113
-
114
-
115
-
116
-
117
-
118
-
119
-
120
-
121
-
122
-
123
-
124
-
125
-
126
-
127
-
128
-
129
-
130
-
131
-
132
-
133
-
134
-
135
-
136
-
137
-
138
-
139
-
140
-
141
-
142
-
143
-
144
-
145
-
146
-
147
-
148
-
149
-
150
-
151
-
152
-
153
-
154
-
155
-
156
-
157
-
158
-
159
-
160
-
161
-
162
-
163
-
164
-
165
-
166
-
167
-
168
-
169
-
170
-
171
-
172
-
173
-
174
-
175
-
176
-
177
-
178
-
179
-
180
-
181
-
182
-
183
-
184
-
185
-
186
-
187
-
188
-
189
-
190
-
191
-
192
-
193
-
194
-
195
-
196
-
197
-
198
-
199
-
200
-
201
-
202
-
203
-
204
-
205
-
206
-
207
-
208
-
209
-
210
-
211
-
212
-
213
-
214
-
215
-
216
-
217
-
218
-
219
-
220
-
221
-
222
-
223
-
224
-
225
-
226
-
227
-
228
-
229
-
230
-
231
-
232
-
233
-
234
-
235
-
236
-
237
-
238
-
239
-
240
-
241
-
242
-
243
-
244
 |
 |
