HP Surestore 64 fw 05.01.00 and sw 07.01.00 - Director Product Manager - User - Page 107
Statistics Description
 |
View all HP Surestore 64 manuals
Add to My Manuals
Save this manual to your list of manuals |
Page 107 highlights
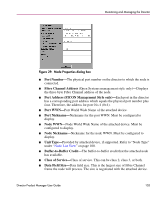
Monitoring and Managing the Director receive traffic, class 2 and class 3 statistics, operational statistics, and error categories. Click a category in the left side of the statistics area to display only statistics for that category or click All to display values for all categories. For a description of the Refresh and Clear buttons, refer to "Button Functions" on page 111. Note: There are not thresholds for these values. You may determine that a problem exists by the rate that the value changes. For example, BB_Credit starvation can occur if data is sent to a device faster than it can consume the frames. This can back up into ISLs, causing degraded performance. Statistics Description The Statistics Values tables contain statistics in the following groups. To refresh tables with the latest data, click Refresh on the upper right portion of the Statistics Values panel or click the port's bar graph. Clear all counters for all users using Clear. Traffic Statistics with Receive and Transmit Values This section describes the types of statistics that display when you click a port's bar graph: ■ Link utilization %-There is a separate value for transmit and receive link utilization. The larger of these two values displays on the bar graph. The current link utilization for the port is expressed as a percentage. Each port can transmit or receive data at 200 megabytes (MB) per second. This statistic shows the percentage of the maximum link utilization currently being used. Link utilization is calculated over one-second intervals. The maximum link utilization is 100%. ■ Frames-The number of frames that the port has received or transmitted. ■ Four byte words-The number of words that the port has received or transmitted. Class 2 Statistics The Class 2 Statistics table includes: ■ Received Frames-The number of Class 2 frames received by this F_Port from its attached N_Port. ■ Transmitted Frames-The number of Class 2 frames transmitted by this F_Port to its attached N_Port. Director Product Manager User Guide 107
-
 1
1 -
2
-
3
-
4
-
5
-
6
-
7
-
8
-
9
-
10
-
11
-
12
-
13
-
14
-
15
-
16
-
17
-
18
-
19
-
20
-
21
-
22
-
23
-
24
-
25
-
26
-
27
-
28
-
29
-
30
-
31
-
32
-
33
-
34
-
35
-
36
-
37
-
38
-
39
-
40
-
41
-
42
-
43
-
44
-
45
-
46
-
47
-
48
-
49
-
50
-
51
-
52
-
53
-
54
-
55
-
56
-
57
-
58
-
59
-
60
-
61
-
62
-
63
-
64
-
65
-
66
-
67
-
68
-
69
-
70
-
71
-
72
-
73
-
74
-
75
-
76
-
77
-
78
-
79
-
80
-
81
-
82
-
83
-
84
-
85
-
86
-
87
-
88
-
89
-
90
-
91
-
92
-
93
-
94
-
95
-
96
-
97
-
98
-
99
-
100
-
101
-
 102
102 -
 103
103 -
 104
104 -
 105
105 -
 106
106 -
 107
107 -
 108
108 -
 109
109 -
 110
110 -
 111
111 -
 112
112 -
113
-
114
-
115
-
116
-
117
-
118
-
119
-
120
-
121
-
122
-
123
-
124
-
125
-
126
-
127
-
128
-
129
-
130
-
131
-
132
-
133
-
134
-
135
-
136
-
137
-
138
-
139
-
140
-
141
-
142
-
143
-
144
-
145
-
146
-
147
-
148
-
149
-
150
-
151
-
152
-
153
-
154
-
155
-
156
-
157
-
158
-
159
-
160
-
161
-
162
-
163
-
164
-
165
-
166
-
167
-
168
-
169
-
170
-
171
-
172
-
173
-
174
-
175
-
176
-
177
-
178
-
179
-
180
-
181
-
182
-
183
-
184
-
185
-
186
-
187
-
188
-
189
-
190
-
191
-
192
-
193
-
194
-
195
-
196
-
197
-
198
-
199
-
200
-
201
-
202
-
203
-
204
-
205
-
206
-
207
-
208
-
209
-
210
-
211
-
212
-
213
-
214
-
215
-
216
-
217
-
218
-
219
-
220
-
221
-
222
-
223
-
224
-
225
-
226
-
227
-
228
-
229
-
230
-
231
-
232
-
233
-
234
-
235
-
236
-
237
-
238
-
239
-
240
-
241
-
242
-
243
-
244
 |
 |
