HP Surestore 64 fw 05.01.00 and sw 07.01.00 - Director Product Manager - User - Page 46
Hardware, Hardware View, Port List, Port List View, FRU List, Node List, Node Properties, Performance
 |
View all HP Surestore 64 manuals
Add to My Manuals
Save this manual to your list of manuals |
Page 46 highlights
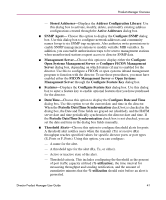
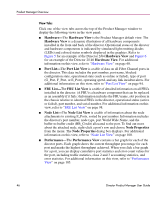
Product Manager Overview View Tabs Click one of the view tabs across the top of the Product Manager window to display the following views in the view panel: ■ Hardware-The Hardware View is the Product Manager default view. The Hardware View is a dynamic illustration of all hardware components installed in the front and back of the director. Operational status of the director and hardware components is indicated by simulated light emitting diodes (LEDs) and colored status symbols displayed in the graphics. Refer to Figure 5 for an example of the Director 2/64 Hardware View and Figure 6 for an example of the Director 2/140 Hardware View. For additional information on this view, refer to "Hardware View" on page 68. ■ Port List-The Port List View is a table of data on all Fibre Channel ports in the director. This data includes the port number, port name, blocked configuration state, operational state (such as online or failed), type of port (G_Port, F_Port, or E_Port), operating speed, and any link incident alerts. For additional information on this view, refer to "Port List View" on page 94. ■ FRU List-The FRU List View is a table of detailed information on all FRUs installed in the director. (A FRU is a hardware component that can be replaced as an assembly if it fails.) Information includes the FRU name, slot position in the chassis relative to identical FRUs in the director, operational status (active or failed), part number, and serial number. For additional information on this view, refer to "FRU List View" on page 98. ■ Node List-The Node List View is a table of information about the node attachments to existing F_Ports, sorted by port number. Information includes the director's port number, node type, port World Wide Name, and the buffer-to-buffer credit (BB_Credit) allocated to the port. To find out more about the attached node, right-click a port's row and choose Node Properties from the menu. The Node Properties dialog box displays. For additional information on this view, refer to "Node List View" on page 100. ■ Performance-The Performance View contains a bar graph for each of the director ports. Each graph shows the current throughput percentage for each port and marks the highest throughput achieved. When you click a bar graph for a port, you can display cumulative port statistics and error count values for the port, including traffic statistics, class 2 and 3 accounting statistics, and error statistics. For additional information on this view, refer to "Performance View" on page 105. 46 Director Product Manager User Guide
-
 1
1 -
2
-
3
-
4
-
5
-
6
-
7
-
8
-
9
-
10
-
11
-
12
-
13
-
14
-
15
-
16
-
17
-
18
-
19
-
20
-
21
-
22
-
23
-
24
-
25
-
26
-
27
-
28
-
29
-
30
-
31
-
32
-
33
-
34
-
35
-
36
-
37
-
38
-
39
-
40
-
 41
41 -
 42
42 -
 43
43 -
 44
44 -
 45
45 -
 46
46 -
 47
47 -
 48
48 -
 49
49 -
 50
50 -
 51
51 -
52
-
53
-
54
-
55
-
56
-
57
-
58
-
59
-
60
-
61
-
62
-
63
-
64
-
65
-
66
-
67
-
68
-
69
-
70
-
71
-
72
-
73
-
74
-
75
-
76
-
77
-
78
-
79
-
80
-
81
-
82
-
83
-
84
-
85
-
86
-
87
-
88
-
89
-
90
-
91
-
92
-
93
-
94
-
95
-
96
-
97
-
98
-
99
-
100
-
101
-
102
-
103
-
104
-
105
-
106
-
107
-
108
-
109
-
110
-
111
-
112
-
113
-
114
-
115
-
116
-
117
-
118
-
119
-
120
-
121
-
122
-
123
-
124
-
125
-
126
-
127
-
128
-
129
-
130
-
131
-
132
-
133
-
134
-
135
-
136
-
137
-
138
-
139
-
140
-
141
-
142
-
143
-
144
-
145
-
146
-
147
-
148
-
149
-
150
-
151
-
152
-
153
-
154
-
155
-
156
-
157
-
158
-
159
-
160
-
161
-
162
-
163
-
164
-
165
-
166
-
167
-
168
-
169
-
170
-
171
-
172
-
173
-
174
-
175
-
176
-
177
-
178
-
179
-
180
-
181
-
182
-
183
-
184
-
185
-
186
-
187
-
188
-
189
-
190
-
191
-
192
-
193
-
194
-
195
-
196
-
197
-
198
-
199
-
200
-
201
-
202
-
203
-
204
-
205
-
206
-
207
-
208
-
209
-
210
-
211
-
212
-
213
-
214
-
215
-
216
-
217
-
218
-
219
-
220
-
221
-
222
-
223
-
224
-
225
-
226
-
227
-
228
-
229
-
230
-
231
-
232
-
233
-
234
-
235
-
236
-
237
-
238
-
239
-
240
-
241
-
242
-
243
-
244
 |
 |
