HP Surestore 64 fw 05.01.00 and sw 07.01.00 - Director Product Manager - User - Page 59
Closing the Product Manager
 |
View all HP Surestore 64 manuals
Add to My Manuals
Save this manual to your list of manuals |
Page 59 highlights
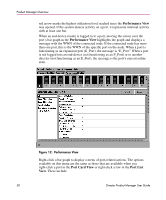
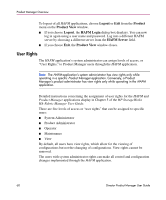
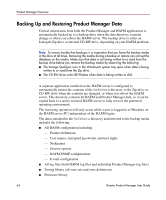
Product Manager Overview ■ Port Properties ■ Node Properties ■ Port Technology ■ Block Port ■ Enable Beaconing ■ Diagnostics ■ Channel Wrap (FICON Management Style only) ■ Swap Ports (FICON Management Style only) ■ Clear Link Incident Alerts ■ Reset Port ■ Port Binding ■ Clear Threshold Alerts Note that these same options also display when you click a port graph and choose the Port secondary menu from the Product menu on the menu bar. For details on port menu options, refer to "Port Menu" on page 82. The bottom portion of the Performance View displays cumulative statistical information for the port selected in the bar graph. Values are displayed for transmit and receive traffic, class 2 and 3 statistics, operational statistics, and error categories. Click a category in the left side of the statistics area to display only statistics in that category or click All to display values for all categories. Click Refresh to update the data with current data from the port. Click Clear to clear all of the counters to zero for the selected port and to place an entry in the audit log indicating that statistics for the port have been cleared. Note: Clearing the counters clears the statistics for all users. For more information about the Performance View, including statistics descriptions, refer to "Performance View" on page 105. Closing the Product Manager To close the Product Manager, choose Close from the Product menu on the menu bar. Director Product Manager User Guide 59
-
 1
1 -
2
-
3
-
4
-
5
-
6
-
7
-
8
-
9
-
10
-
11
-
12
-
13
-
14
-
15
-
16
-
17
-
18
-
19
-
20
-
21
-
22
-
23
-
24
-
25
-
26
-
27
-
28
-
29
-
30
-
31
-
32
-
33
-
34
-
35
-
36
-
37
-
38
-
39
-
40
-
41
-
42
-
43
-
44
-
45
-
46
-
47
-
48
-
49
-
50
-
51
-
52
-
53
-
 54
54 -
 55
55 -
 56
56 -
 57
57 -
 58
58 -
 59
59 -
 60
60 -
 61
61 -
 62
62 -
 63
63 -
 64
64 -
65
-
66
-
67
-
68
-
69
-
70
-
71
-
72
-
73
-
74
-
75
-
76
-
77
-
78
-
79
-
80
-
81
-
82
-
83
-
84
-
85
-
86
-
87
-
88
-
89
-
90
-
91
-
92
-
93
-
94
-
95
-
96
-
97
-
98
-
99
-
100
-
101
-
102
-
103
-
104
-
105
-
106
-
107
-
108
-
109
-
110
-
111
-
112
-
113
-
114
-
115
-
116
-
117
-
118
-
119
-
120
-
121
-
122
-
123
-
124
-
125
-
126
-
127
-
128
-
129
-
130
-
131
-
132
-
133
-
134
-
135
-
136
-
137
-
138
-
139
-
140
-
141
-
142
-
143
-
144
-
145
-
146
-
147
-
148
-
149
-
150
-
151
-
152
-
153
-
154
-
155
-
156
-
157
-
158
-
159
-
160
-
161
-
162
-
163
-
164
-
165
-
166
-
167
-
168
-
169
-
170
-
171
-
172
-
173
-
174
-
175
-
176
-
177
-
178
-
179
-
180
-
181
-
182
-
183
-
184
-
185
-
186
-
187
-
188
-
189
-
190
-
191
-
192
-
193
-
194
-
195
-
196
-
197
-
198
-
199
-
200
-
201
-
202
-
203
-
204
-
205
-
206
-
207
-
208
-
209
-
210
-
211
-
212
-
213
-
214
-
215
-
216
-
217
-
218
-
219
-
220
-
221
-
222
-
223
-
224
-
225
-
226
-
227
-
228
-
229
-
230
-
231
-
232
-
233
-
234
-
235
-
236
-
237
-
238
-
239
-
240
-
241
-
242
-
243
-
244
 |
 |
