Dell EqualLogic PS6210XS EqualLogic Group Manager Administrator s Guide PS Ser - Page 363
About Monitoring, About NAS Clusters
 |
View all Dell EqualLogic PS6210XS manuals
Add to My Manuals
Save this manual to your list of manuals |
Page 363 highlights
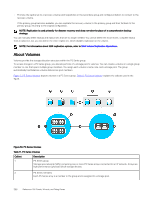
Panel Description • All partners - Amount of space being used in each category on all partners Replica sets on partner "group (n)" Displays information about all of the replica sets on the group or only those replica sets that are borrowing space. The information is shown in the following categories: • Volume - Name of the replica sets on the selected partner • Number of replicas - Number of replicas in the replica set • Total reserves - Amount of space allocated for replicas on the volume • Total size - Amount of space being used for replicas on the volume • Reserves used - Amount of reserved space being used for replicas on the volume • Space borrowed - Amount of space borrowed for replicas on the volume • Total - Amount of space being used in each category for all volumes About Monitoring You can review comprehensive data about your array groups. Monitoring your PS Series array groups provides data that enables you to assess the health of your storage environment to quickly identify hardware and software problems. Monitoring provides valuable data about the time and action of users on the system, protecting against security intrusions. Using Dell EqualLogic performance monitoring tools, you can gather information about group performance based on latency, IOPS, I/O rate, I/O size, and other data. With this data, you can quickly be informed of hardware, capacity, and performance-related problems, allowing you to make corrections and minimize downtime. Monitored data is invaluable when accessing your customer support account and reporting problems directly to technical support. • Events - Displays events to track operations and also to detect and solve problems before they affect performance or data availability. Audit messages are syslog events about administrator actions. They provide historical reference to actions such as logging in, logging out, creating a volume, setting up replication, and other events. In addition, you can use SNMP traps to track significant group events. • Statistics - Displays information about the current and recent administrative sessions and the number of active iSCSI connections. • Schedules - Displays the total number of snapshot and replication schedules. • NAS Schedules - Displays NAS snapshot, replication, and data reduction schedules. • Replication - Displays active replication activity (including inbound and outbound replication), and replication history. • NAS Replication - Displays active NAS replication activity (including inbound and outbound replica containers), and NAS replication history. • Sync Rep - Displays information about SyncRep volumes. • Alarms and Operations - Displays a visual cue to alarm conditions in the group, as well as in-progress operations. Some operations might need administrator intervention. The cues are displayed for critical and warning alarms, actions, group operations, and failback operations. About NAS Clusters NAS clusters enable integration of file storage and block storage. A NAS cluster contains hardware with two redundant, hotswappable controllers and RAID protection for internal-use disks. The scalable Dell Fluid File System (FluidFS) enables PS Series storage arrays to store NAS cluster and client data. A NAS cluster is made up of NAS appliances, configured and networked as described in your NAS appliance hardware documentation. Reference: GUI Panels, Wizards, and Dialog Boxes 363
-
 1
1 -
2
-
3
-
4
-
5
-
6
-
7
-
8
-
9
-
10
-
11
-
12
-
13
-
14
-
15
-
16
-
17
-
18
-
19
-
20
-
21
-
22
-
23
-
24
-
25
-
26
-
27
-
28
-
29
-
30
-
31
-
32
-
33
-
34
-
35
-
36
-
37
-
38
-
39
-
40
-
41
-
42
-
43
-
44
-
45
-
46
-
47
-
48
-
49
-
50
-
51
-
52
-
53
-
54
-
55
-
56
-
57
-
58
-
59
-
60
-
61
-
62
-
63
-
64
-
65
-
66
-
67
-
68
-
69
-
70
-
71
-
72
-
73
-
74
-
75
-
76
-
77
-
78
-
79
-
80
-
81
-
82
-
83
-
84
-
85
-
86
-
87
-
88
-
89
-
90
-
91
-
92
-
93
-
94
-
95
-
96
-
97
-
98
-
99
-
100
-
101
-
102
-
103
-
104
-
105
-
106
-
107
-
108
-
109
-
110
-
111
-
112
-
113
-
114
-
115
-
116
-
117
-
118
-
119
-
120
-
121
-
122
-
123
-
124
-
125
-
126
-
127
-
128
-
129
-
130
-
131
-
132
-
133
-
134
-
135
-
136
-
137
-
138
-
139
-
140
-
141
-
142
-
143
-
144
-
145
-
146
-
147
-
148
-
149
-
150
-
151
-
152
-
153
-
154
-
155
-
156
-
157
-
158
-
159
-
160
-
161
-
162
-
163
-
164
-
165
-
166
-
167
-
168
-
169
-
170
-
171
-
172
-
173
-
174
-
175
-
176
-
177
-
178
-
179
-
180
-
181
-
182
-
183
-
184
-
185
-
186
-
187
-
188
-
189
-
190
-
191
-
192
-
193
-
194
-
195
-
196
-
197
-
198
-
199
-
200
-
201
-
202
-
203
-
204
-
205
-
206
-
207
-
208
-
209
-
210
-
211
-
212
-
213
-
214
-
215
-
216
-
217
-
218
-
219
-
220
-
221
-
222
-
223
-
224
-
225
-
226
-
227
-
228
-
229
-
230
-
231
-
232
-
233
-
234
-
235
-
236
-
237
-
238
-
239
-
240
-
241
-
242
-
243
-
244
-
245
-
246
-
247
-
248
-
249
-
250
-
251
-
252
-
253
-
254
-
255
-
256
-
257
-
258
-
259
-
260
-
261
-
262
-
263
-
264
-
265
-
266
-
267
-
268
-
269
-
270
-
271
-
272
-
273
-
274
-
275
-
276
-
277
-
278
-
279
-
280
-
281
-
282
-
283
-
284
-
285
-
286
-
287
-
288
-
289
-
290
-
291
-
292
-
293
-
294
-
295
-
296
-
297
-
298
-
299
-
300
-
301
-
302
-
303
-
304
-
305
-
306
-
307
-
308
-
309
-
310
-
311
-
312
-
313
-
314
-
315
-
316
-
317
-
318
-
319
-
320
-
321
-
322
-
323
-
324
-
325
-
326
-
327
-
328
-
329
-
330
-
331
-
332
-
333
-
334
-
335
-
336
-
337
-
338
-
339
-
340
-
341
-
342
-
343
-
344
-
345
-
346
-
347
-
348
-
349
-
350
-
351
-
352
-
353
-
354
-
355
-
356
-
357
-
 358
358 -
 359
359 -
 360
360 -
 361
361 -
 362
362 -
 363
363 -
 364
364 -
 365
365 -
 366
366 -
 367
367 -
 368
368 -
369
-
370
-
371
-
372
-
373
-
374
-
375
-
376
-
377
-
378
-
379
-
380
-
381
-
382
-
383
-
384
-
385
-
386
-
387
-
388
-
389
-
390
-
391
-
392
-
393
-
394
-
395
-
396
-
397
-
398
-
399
-
400
-
401
-
402
-
403
-
404
-
405
-
406
-
407
-
408
-
409
-
410
-
411
-
412
-
413
-
414
-
415
-
416
-
417
-
418
-
419
-
420
-
421
-
422
-
423
-
424
-
425
-
426
-
427
-
428
-
429
-
430
-
431
-
432
-
433
-
434
-
435
-
436
-
437
-
438
-
439
-
440
-
441
-
442
-
443
-
444
-
445
-
446
-
447
-
448
-
449
-
450
-
451
-
452
-
453
-
454
-
455
-
456
-
457
-
458
-
459
-
460
-
461
-
462
-
463
-
464
-
465
-
466
-
467
-
468
-
469
-
470
-
471
-
472
-
473
-
474
-
475
-
476
-
477
-
478
-
479
-
480
-
481
-
482
-
483
-
484
-
485
-
486
-
487
-
488
-
489
-
490
-
491
-
492
-
493
-
494
-
495
-
496
-
497
-
498
-
499
-
500
-
501
-
502
-
503
-
504
-
505
-
506
-
507
-
508
-
509
-
510
-
511
-
512
-
513
-
514
-
515
-
516
-
517
-
518
-
519
-
520
-
521
-
522
-
523
-
524
-
525
-
526
-
527
-
528
-
529
-
530
-
531
-
532
-
533
-
534
-
535
-
536
-
537
-
538
-
539
-
540
-
541
-
542
-
543
-
544
-
545
-
546
-
547
-
548
-
549
-
550
-
551
-
552
-
553
-
554
-
555
-
556
-
557
-
558
-
559
-
560
-
561
-
562
-
563
-
564
-
565
-
566
-
567
-
568
-
569
-
570
-
571
-
572
-
573
-
574
-
575
-
576
-
577
-
578
-
579
-
580
-
581
-
582
-
583
 |
 |