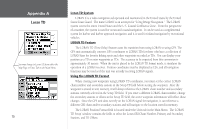
Garmin GPS 152 Owner's Manual - Page 78
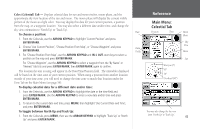
Main Menu, Tide Tab
 |
UPC - 753759028145
View all Garmin GPS 152 manuals
Add to My Manuals
Save this manual to your list of manuals |
Page 78 highlights
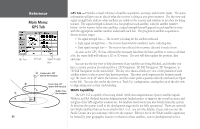
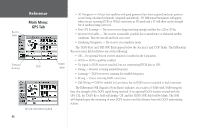
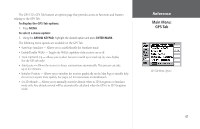
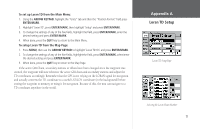
Reference Main Menu: Tide Tab Tide Tab Menu Options You can select from a list of nearest stations or from the map. 68 Tide Tab- shows a graphical chart which displays tide station information in a 24 hour span starting at midnight station time. You can choose from different dates and over 3000 tide stations around the USA coastline, Alaska, Hawaii, western Canada and several of the Caribbean islands. The top of the page displays the tide station being referenced, to the right, the date. The top of the chart shows a 24-hour block of local time (LCL) for your position, with the reported station time (STA) appearing at the bottom. Daylight (light bar) and nighttime (dark bar) show across the time scale, with the time progressing from left to right (Local time scales may not be available for a few stations). The solid, light vertical lines are in 4-hour increments, and the light, dotted vertical lines are in 1-hour increments. A dark, vertical line (with arrows at the ends of the line) will indicate the time of day when using the current date and will intersect the tide graph to show their relation. Local Time Date Max. Level High Tide Curve Low Tide Curve Min. Level Station Time Current Tide Height Current Time MLLW Night Event Times The tide curve shows as a shaded area, with higher tides being taller and lower tides shorter. The dark, horizontal line (with arrows at the ends of the line) indicates the current tide height. The figure to the left of the line will show the current tide level in feet. The Mean Lower Low Water (MLLW) appears as a solid, horizontal line near the bottom of the chart (This line will only appear if the tide ranges to the zero value or below). The numbers directly below/above 'LCL' and 'STA' indicate the maximum/minimum levels, respectively. The four data fields below the chart, indicate event times and levels at which the tide changes starting in the upper left field, going downward, then to the upper right and down again.
-
 1
1 -
2
-
3
-
4
-
5
-
6
-
7
-
8
-
9
-
10
-
11
-
12
-
13
-
14
-
15
-
16
-
17
-
18
-
19
-
20
-
21
-
22
-
23
-
24
-
25
-
26
-
27
-
28
-
29
-
30
-
31
-
32
-
33
-
34
-
35
-
36
-
37
-
38
-
39
-
40
-
41
-
42
-
43
-
44
-
45
-
46
-
47
-
48
-
49
-
50
-
51
-
52
-
53
-
54
-
55
-
56
-
57
-
58
-
59
-
60
-
61
-
62
-
63
-
64
-
65
-
66
-
67
-
68
-
69
-
70
-
71
-
72
-
 73
73 -
 74
74 -
 75
75 -
 76
76 -
 77
77 -
 78
78 -
 79
79 -
 80
80 -
 81
81 -
 82
82 -
 83
83 -
84
-
85
-
86
-
87
-
88
-
89
-
90
-
91
-
92
-
93
-
94
-
95
-
96
-
97
-
98
 |
 |
