HP 6125XLG R2306-HP 6125XLG Blade Switch Network Management and Monitoring Com - Page 168
display process cpu, Table 42, Command output
 |
View all HP 6125XLG manuals
Add to My Manuals
Save this manual to your list of manuals |
Page 168 highlights
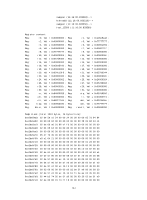
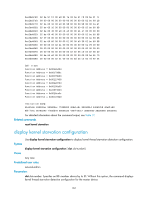
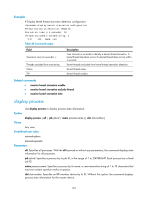
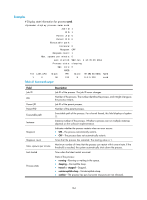
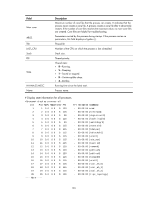
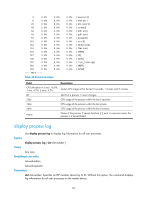
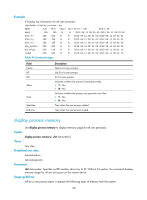
Table 42 Command output Field JID PID %CPU %MEM STAT PRI TTY HH:MM:SS COMMAND Description Job ID of a process. It never changes. Number of a process. CPU usage in percentage (%). Memory usage in percentage (%). State of a process: • R-Running. • S-Sleeping. • T-Traced or stopped. • D-Uninterruptible sleep. • Z-Zombie. Priority of a process for scheduling. TTY used by a process. Running time since the latest start. Name and parameters of a process. If square brackets ([ ]) exist in a process name, the process is a kernel thread. display process cpu Use display process cpu to display CPU usage for all processes. Syntax display process cpu [ slot slot-number ] Views Any view Predefined user roles network-admin network-operator Parameters slot slot-number: Specifies an IRF member device by its ID. Without this option, the command displays CPU usage for all processes on the master device. Examples # Display CPU usage for all processes. display process cpu CPU utilization in 5 secs: 16.8%; 1 min: 4.7%; 5 mins: 4.7% JID 5Sec 1Min 5Min Name 1 0.0% 0.0% 0.0% scmd 2 0.0% 0.0% 0.0% [kthreadd] 3 0.1% 0.0% 0.0% [ksoftirqd/0] 4 0.0% 0.0% 0.0% [watchdog/0] 166
-
 1
1 -
2
-
3
-
4
-
5
-
6
-
7
-
8
-
9
-
10
-
11
-
12
-
13
-
14
-
15
-
16
-
17
-
18
-
19
-
20
-
21
-
22
-
23
-
24
-
25
-
26
-
27
-
28
-
29
-
30
-
31
-
32
-
33
-
34
-
35
-
36
-
37
-
38
-
39
-
40
-
41
-
42
-
43
-
44
-
45
-
46
-
47
-
48
-
49
-
50
-
51
-
52
-
53
-
54
-
55
-
56
-
57
-
58
-
59
-
60
-
61
-
62
-
63
-
64
-
65
-
66
-
67
-
68
-
69
-
70
-
71
-
72
-
73
-
74
-
75
-
76
-
77
-
78
-
79
-
80
-
81
-
82
-
83
-
84
-
85
-
86
-
87
-
88
-
89
-
90
-
91
-
92
-
93
-
94
-
95
-
96
-
97
-
98
-
99
-
100
-
101
-
102
-
103
-
104
-
105
-
106
-
107
-
108
-
109
-
110
-
111
-
112
-
113
-
114
-
115
-
116
-
117
-
118
-
119
-
120
-
121
-
122
-
123
-
124
-
125
-
126
-
127
-
128
-
129
-
130
-
131
-
132
-
133
-
134
-
135
-
136
-
137
-
138
-
139
-
140
-
141
-
142
-
143
-
144
-
145
-
146
-
147
-
148
-
149
-
150
-
151
-
152
-
153
-
154
-
155
-
156
-
157
-
158
-
159
-
160
-
161
-
162
-
 163
163 -
 164
164 -
 165
165 -
 166
166 -
 167
167 -
 168
168 -
 169
169 -
 170
170 -
 171
171 -
 172
172 -
 173
173 -
174
-
175
-
176
-
177
-
178
-
179
-
180
-
181
-
182
-
183
-
184
-
185
-
186
-
187
-
188
-
189
-
190
-
191
-
192
-
193
-
194
-
195
-
196
-
197
-
198
-
199
-
200
-
201
-
202
-
203
-
204
-
205
-
206
-
207
 |
 |