HP 6125XLG R2306-HP 6125XLG Blade Switch Network Management and Monitoring Com - Page 181
Table 47, Interactive commands, Commands, Description
 |
View all HP 6125XLG manuals
Add to My Manuals
Save this manual to your list of manuals |
Page 181 highlights
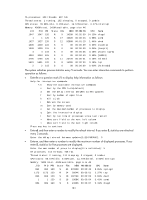
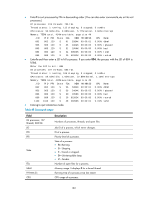
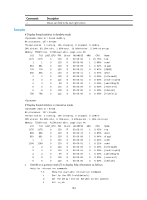
Table 47 Interactive commands Commands ? or h c d f k l m n q t < > Description Displays help information that includes available interactive commands. Sorts processes by CPU usage in descending order, which is the default setting. Sets the interval for refreshing process statistics, in the range of 1 to 2147483647 seconds. The default value is 5 seconds. Sorts processes by the number of open files in descending order. Files are identified by file descriptors (FDs). Kills a process. Because the command can impact system operation, be cautious to use it. Refreshes the screen. Sorts processes by memory usage in descending order. Changes the maximum number of processes displayed within a screen, in the range of 0 to 2147483647. The default value is 10. A value of 0 means no limit. Only processes not exceeding the screen size can be displayed. Quits the interactive mode. Sorts processes by running time in descending order. Moves sort field to the next left column. Moves sort field to the next right column. Examples # Display process statistics in dumbtty mode. In this mode, the system displays process statistics once, and then returns to command view. monitor process dumbtty 76 processes; 103 threads; 687 fds Thread states: 1 running, 102 sleeping, 0 stopped, 0 zombie CPU states: 77.16% idle, 0.00% user, 14.96% kernel, 7.87% interrupt Memory: 496M total, 341M available, page size 4K JID PID PRI State FDs MEM HH:MM:SS CPU Name 1047 1047 120 R 9 1420K 00:02:23 13.53% diagd 1 1 120 S 17 1092K 00:00:20 7.61% scmd 1000 1000 115 S 0 0K 00:00:09 0.84% [sock/1] 1026 1026 120 S 20 26044K 00:00:05 0.84% syslogd 2 2 115 S 0 0K 00:00:00 0.00% [kthreadd] 3 3 99 S 0 0K 00:00:00 0.00% [migration/0] 4 4 115 S 0 0K 00:00:06 0.00% [ksoftirqd/0] 5 5 99 S 0 0K 00:00:00 0.00% [watchdog/0] 6 6 115 S 0 0K 00:00:01 0.00% [events/0] 7 7 115 S 0 0K 00:00:00 0.00% [khelper] 4797 4797 120 S 8 28832K 00:00:02 0.00% comsh 5117 5117 120 S 8 1496K 00:00:00 0.00% top # Display process statistics twice in dumbtty mode. monitor process dumbtty iteration 2 179
-
 1
1 -
2
-
3
-
4
-
5
-
6
-
7
-
8
-
9
-
10
-
11
-
12
-
13
-
14
-
15
-
16
-
17
-
18
-
19
-
20
-
21
-
22
-
23
-
24
-
25
-
26
-
27
-
28
-
29
-
30
-
31
-
32
-
33
-
34
-
35
-
36
-
37
-
38
-
39
-
40
-
41
-
42
-
43
-
44
-
45
-
46
-
47
-
48
-
49
-
50
-
51
-
52
-
53
-
54
-
55
-
56
-
57
-
58
-
59
-
60
-
61
-
62
-
63
-
64
-
65
-
66
-
67
-
68
-
69
-
70
-
71
-
72
-
73
-
74
-
75
-
76
-
77
-
78
-
79
-
80
-
81
-
82
-
83
-
84
-
85
-
86
-
87
-
88
-
89
-
90
-
91
-
92
-
93
-
94
-
95
-
96
-
97
-
98
-
99
-
100
-
101
-
102
-
103
-
104
-
105
-
106
-
107
-
108
-
109
-
110
-
111
-
112
-
113
-
114
-
115
-
116
-
117
-
118
-
119
-
120
-
121
-
122
-
123
-
124
-
125
-
126
-
127
-
128
-
129
-
130
-
131
-
132
-
133
-
134
-
135
-
136
-
137
-
138
-
139
-
140
-
141
-
142
-
143
-
144
-
145
-
146
-
147
-
148
-
149
-
150
-
151
-
152
-
153
-
154
-
155
-
156
-
157
-
158
-
159
-
160
-
161
-
162
-
163
-
164
-
165
-
166
-
167
-
168
-
169
-
170
-
171
-
172
-
173
-
174
-
175
-
 176
176 -
 177
177 -
 178
178 -
 179
179 -
 180
180 -
 181
181 -
 182
182 -
 183
183 -
 184
184 -
 185
185 -
 186
186 -
187
-
188
-
189
-
190
-
191
-
192
-
193
-
194
-
195
-
196
-
197
-
198
-
199
-
200
-
201
-
202
-
203
-
204
-
205
-
206
-
207
 |
 |
