HP 6125XLG R2306-HP 6125XLG Blade Switch Network Management and Monitoring Com - Page 182
Display process statistics in interactive mode., command twice at a 5-second interval
 |
View all HP 6125XLG manuals
Add to My Manuals
Save this manual to your list of manuals |
Page 182 highlights
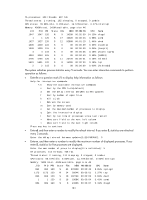
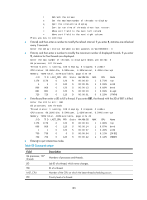
76 processes; 103 threads; 687 fds Thread states: 1 running, 102 sleeping, 0 stopped, 0 zombie CPU states: 44.84% idle, 0.51% user, 39.17% kernel, 15.46% interrupt Memory: 496M total, 341M available, page size 4K JID PID PRI State FDs MEM HH:MM:SS CPU Name 1047 1047 120 R 9 1420K 00:02:30 37.11% diagd 1 1 120 S 17 1092K 00:00:21 11.34% scmd 1000 1000 115 S 0 0K 00:00:09 2.06% [sock/1] 1026 1026 120 S 20 26044K 00:00:05 1.54% syslogd 1027 1027 120 S 12 9280K 00:01:12 1.03% devd 4 4 115 S 0 0K 00:00:06 0.51% [ksoftirqd/0] 1009 1009 115 S 0 0K 00:00:08 0.51% [karp/1] 1010 1010 115 S 0 0K 00:00:13 0.51% [kND/1] 5373 5373 120 S 8 1496K 00:00:00 0.51% top 2 2 115 S 0 0K 00:00:00 0.00% [kthreadd] 3 3 99 S 0 0K 00:00:00 0.00% [migration/0] 5 5 99 S 0 0K 00:00:00 0.00% [watchdog/0] 6 6 115 S 0 0K 00:00:01 0.00% [events/0] 7 7 115 S 0 0K 00:00:00 0.00% [khelper] 4796 4796 120 S 11 2744K 00:00:00 0.00% login 4797 4797 120 S 8 28832K 00:00:03 0.00% comsh Five seconds later, the system refreshes process statistics as follows (which is the same as executing the monitor process dumbtty command twice at a 5-second interval): 76 processes; 103 threads; 687 fds Thread states: 1 running, 102 sleeping, 0 stopped, 0 zombie CPU states: 78.71% idle, 0.16% user, 14.86% kernel, 6.25% interrupt Memory: 496M total, 341M available, page size 4K JID PID PRI State FDs MEM HH:MM:SS CPU Name 1047 1047 120 R 9 1420K 00:02:31 14.25% diagd 1 1 120 S 17 1092K 00:00:21 4.25% scmd 1027 1027 120 S 12 9280K 00:01:12 1.29% devd 1000 1000 115 S 0 0K 00:00:09 0.37% [sock/1] 5373 5373 120 S 8 1500K 00:00:00 0.37% top 6 6 115 S 0 0K 00:00:01 0.18% [events/0] 1009 1009 115 S 0 0K 00:00:08 0.18% [karp/1] 1010 1010 115 S 0 0K 00:00:13 0.18% [kND/1] 4795 4795 120 S 11 2372K 00:00:01 0.18% telnetd 2 2 115 S 0 0K 00:00:00 0.00% [kthreadd] 3 3 99 S 0 0K 00:00:00 0.00% [migration/0] 4 4 115 S 0 0K 00:00:06 0.00% [ksoftirqd/0] 5 5 99 S 0 0K 00:00:00 0.00% [watchdog/0] 7 7 115 S 0 0K 00:00:00 0.00% [khelper] 4796 4796 120 S 11 2744K 00:00:00 0.00% login 4797 4797 120 S 8 28832K 00:00:03 0.00% comsh # Display process statistics in interactive mode. monitor process 180
-
 1
1 -
2
-
3
-
4
-
5
-
6
-
7
-
8
-
9
-
10
-
11
-
12
-
13
-
14
-
15
-
16
-
17
-
18
-
19
-
20
-
21
-
22
-
23
-
24
-
25
-
26
-
27
-
28
-
29
-
30
-
31
-
32
-
33
-
34
-
35
-
36
-
37
-
38
-
39
-
40
-
41
-
42
-
43
-
44
-
45
-
46
-
47
-
48
-
49
-
50
-
51
-
52
-
53
-
54
-
55
-
56
-
57
-
58
-
59
-
60
-
61
-
62
-
63
-
64
-
65
-
66
-
67
-
68
-
69
-
70
-
71
-
72
-
73
-
74
-
75
-
76
-
77
-
78
-
79
-
80
-
81
-
82
-
83
-
84
-
85
-
86
-
87
-
88
-
89
-
90
-
91
-
92
-
93
-
94
-
95
-
96
-
97
-
98
-
99
-
100
-
101
-
102
-
103
-
104
-
105
-
106
-
107
-
108
-
109
-
110
-
111
-
112
-
113
-
114
-
115
-
116
-
117
-
118
-
119
-
120
-
121
-
122
-
123
-
124
-
125
-
126
-
127
-
128
-
129
-
130
-
131
-
132
-
133
-
134
-
135
-
136
-
137
-
138
-
139
-
140
-
141
-
142
-
143
-
144
-
145
-
146
-
147
-
148
-
149
-
150
-
151
-
152
-
153
-
154
-
155
-
156
-
157
-
158
-
159
-
160
-
161
-
162
-
163
-
164
-
165
-
166
-
167
-
168
-
169
-
170
-
171
-
172
-
173
-
174
-
175
-
176
-
 177
177 -
 178
178 -
 179
179 -
 180
180 -
 181
181 -
 182
182 -
 183
183 -
 184
184 -
 185
185 -
 186
186 -
 187
187 -
188
-
189
-
190
-
191
-
192
-
193
-
194
-
195
-
196
-
197
-
198
-
199
-
200
-
201
-
202
-
203
-
204
-
205
-
206
-
207
 |
 |