Dell PowerConnect W-IAP92 Dell Instant 6.1.2.3-2.0.0.0 User Guide - Page 33
Alerts, Usage Trends
 |
View all Dell PowerConnect W-IAP92 manuals
Add to My Manuals
Save this manual to your list of manuals |
Page 33 highlights
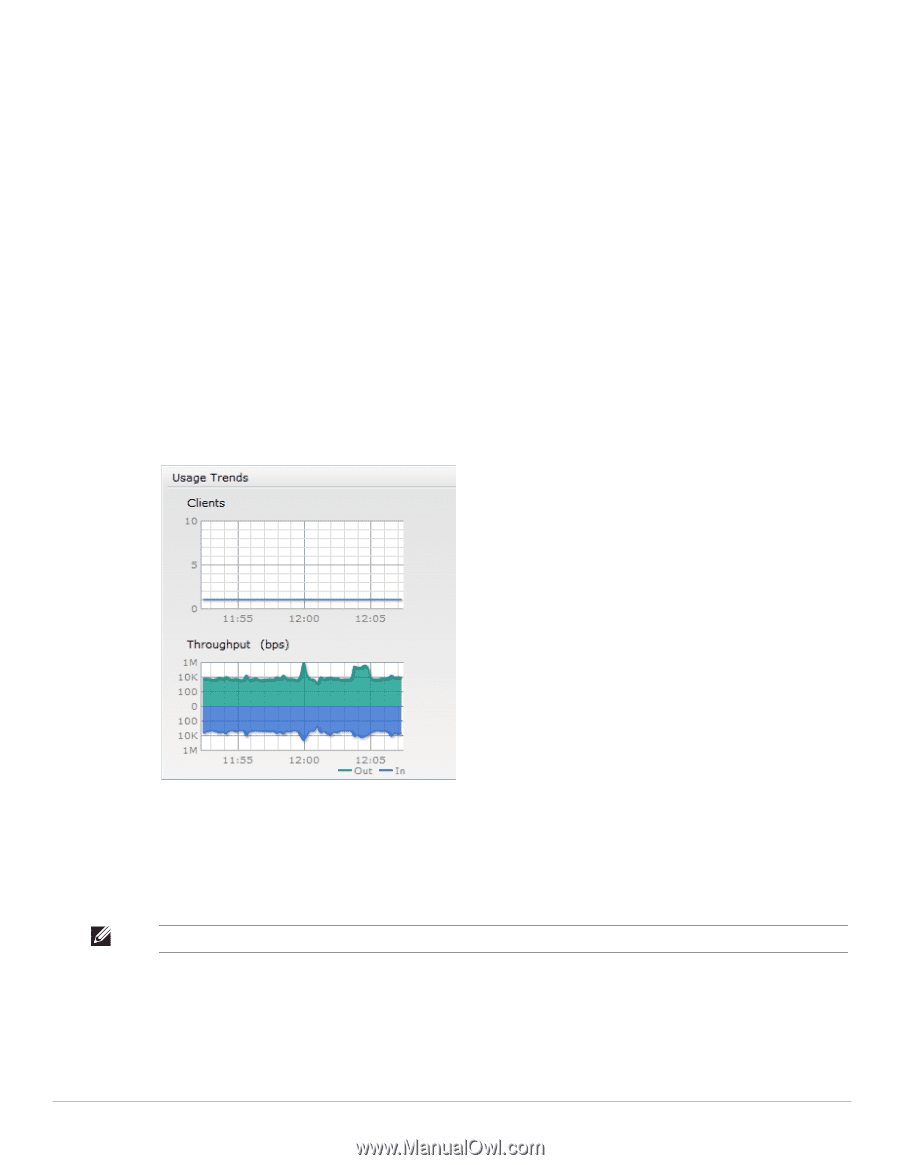
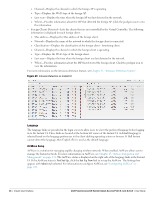
To view the noise floor graph of an IAP, click on the noise icon against the IAP in the Noise column. Errors-Displays the errors for the IAPs. Depending on the errors, color of the lines on the Errors icon changes from Green > Yellow > Red. Green-Errors are less than 5000 frames per second. Orange-Errors are between 5000 - 10000 frames per second. Red-Errors are more than 10000 frames per second. To view the errors graph of an IAP, click on the Errors icon against the IAP in the Errors column. Usage Trends Displays the following graphs: Clients-In the default Virtual Controller view, the Clients graph displays the number of clients that were associated with the Virtual Controller in the last 15 minutes. In Network or IAP view, this graph displays the number of clients that were associated with the selected network or IAP in the last 15 minutes. Throughput-In the default Virtual Controller view, the Throughput graph displays the incoming and outgoing throughput traffic for the Virtual Controller in the last 15 minutes. In the Network or IAP view, this graph displays the incoming and outgoing throughput traffic for the selected network or IAP in the last 15 minutes. Figure 18 Usage Trends Section in the Monitoring Pane For more information about the graphs and monitoring procedures, see Chapter 18, "Monitoring" . Alerts Alerts are generated when a user faces problems while accessing or connecting to the Wi-Fi network. The Alerts link appears in red only if there are any Client Alerts, Active Faults, and Fault History. NOTE: New alerts will be generated for an incomplete DHCP transaction of a client. Dell PowerConnect W-Series Instant Access Point 6.1.2.3-2.0.0.0 | User Guide Instant User Interface | 33
-
 1
1 -
2
-
3
-
4
-
5
-
6
-
7
-
8
-
9
-
10
-
11
-
12
-
13
-
14
-
15
-
16
-
17
-
18
-
19
-
20
-
21
-
22
-
23
-
24
-
25
-
26
-
27
-
 28
28 -
 29
29 -
 30
30 -
 31
31 -
 32
32 -
 33
33 -
 34
34 -
 35
35 -
 36
36 -
 37
37 -
 38
38 -
39
-
40
-
41
-
42
-
43
-
44
-
45
-
46
-
47
-
48
-
49
-
50
-
51
-
52
-
53
-
54
-
55
-
56
-
57
-
58
-
59
-
60
-
61
-
62
-
63
-
64
-
65
-
66
-
67
-
68
-
69
-
70
-
71
-
72
-
73
-
74
-
75
-
76
-
77
-
78
-
79
-
80
-
81
-
82
-
83
-
84
-
85
-
86
-
87
-
88
-
89
-
90
-
91
-
92
-
93
-
94
-
95
-
96
-
97
-
98
-
99
-
100
-
101
-
102
-
103
-
104
-
105
-
106
-
107
-
108
-
109
-
110
-
111
-
112
-
113
-
114
-
115
-
116
-
117
-
118
-
119
-
120
-
121
-
122
-
123
-
124
-
125
-
126
-
127
-
128
-
129
-
130
-
131
-
132
-
133
-
134
-
135
-
136
-
137
-
138
-
139
-
140
-
141
-
142
-
143
-
144
-
145
-
146
-
147
-
148
-
149
-
150
-
151
-
152
-
153
-
154
-
155
-
156
-
157
-
158
 |
 |