Dell PowerConnect W-IAP92 Dell Instant 6.1.3.1-3.0.0.0 User Guide - Page 176
Monitoring Link, Info, RF Dashboard, Usage Trends,
 |
View all Dell PowerConnect W-IAP92 manuals
Add to My Manuals
Save this manual to your list of manuals |
Page 176 highlights
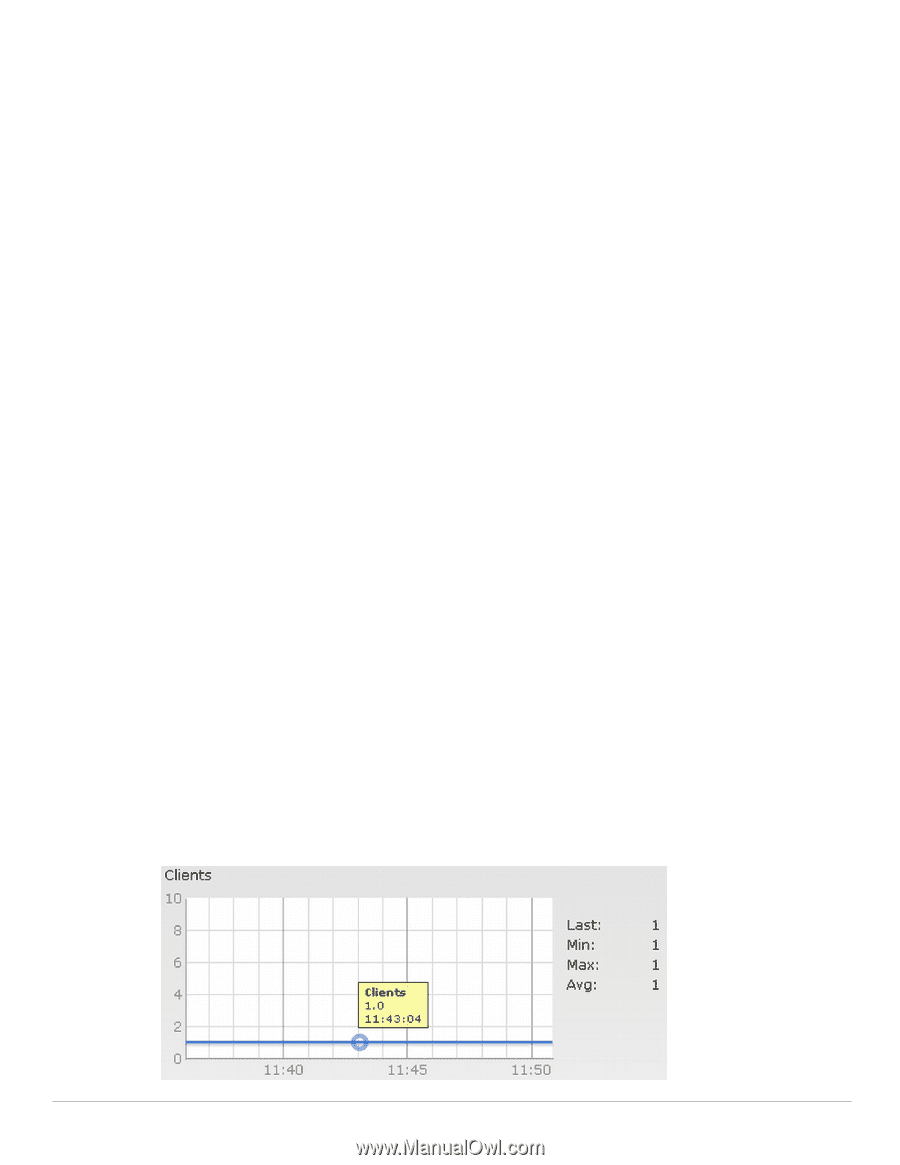
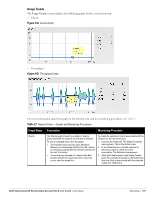
Monitoring Link This link is selected by default and the following sections are displayed. These sections provide information about the Virtual Controller and allow you to monitor the network. Info RF Dashboard Usage Trends Info The Info section displays the following information about the Virtual Controller: Name- Displays the Virtual Controller name. Country Code- Displays the Country in which the Virtual Controller is operating. Virtual Controller IP address- Displays the IP address of the Virtual Controller. Dell PowerConnect W-AirWave IP- Displays the IP address of the Dell PowerConnect W-AirWave server. Band- Displays the band in which the Virtual Controller is operating- 2.4 GHz band, 5.4 GHz band, or both. Master- Displays the IP address of the Access Point acting as a Virtual Controller. OpenDNS Status- Displays the OpenDNS status. If the OpenDNS is Not connected, make sure you have provided the correct credentials on the OpenDNS tab of the Settings window. In addition, please check if the Internet connection is up. Uplink type- Displays the type of uplink- Ethernet and 3G Uplink status- Displays whether the uplink is up or down. RF Dashboard The RF Dashboard section displays the following information: IP address, Signal, and Speed information about the clients in the Dell Instant network. If the speed or signal strength of a client is low, IP address of the client appears as a link. Click the link to monitor the client. For more information, see "Client View" on page 184. Instant Access Points, Utilization, Noise, and Errors information about the IAPs in the Dell Instant network. If utilization, noise or errors of an IAP are not within the specified threshold, the IAP name appears as a link. Click the link to monitor the IAP. For more information, see "Instant Access Point View" on page 180. Usage Trends The Usage Trends section displays the following graphs for the Virtual Controller: Clients Graph Figure 141 Clients Graph 176 | Monitoring Dell PowerConnect W-Series Instant Access Point 6.1.3.1-3.0.0.0 | User Guide
-
 1
1 -
2
-
3
-
4
-
5
-
6
-
7
-
8
-
9
-
10
-
11
-
12
-
13
-
14
-
15
-
16
-
17
-
18
-
19
-
20
-
21
-
22
-
23
-
24
-
25
-
26
-
27
-
28
-
29
-
30
-
31
-
32
-
33
-
34
-
35
-
36
-
37
-
38
-
39
-
40
-
41
-
42
-
43
-
44
-
45
-
46
-
47
-
48
-
49
-
50
-
51
-
52
-
53
-
54
-
55
-
56
-
57
-
58
-
59
-
60
-
61
-
62
-
63
-
64
-
65
-
66
-
67
-
68
-
69
-
70
-
71
-
72
-
73
-
74
-
75
-
76
-
77
-
78
-
79
-
80
-
81
-
82
-
83
-
84
-
85
-
86
-
87
-
88
-
89
-
90
-
91
-
92
-
93
-
94
-
95
-
96
-
97
-
98
-
99
-
100
-
101
-
102
-
103
-
104
-
105
-
106
-
107
-
108
-
109
-
110
-
111
-
112
-
113
-
114
-
115
-
116
-
117
-
118
-
119
-
120
-
121
-
122
-
123
-
124
-
125
-
126
-
127
-
128
-
129
-
130
-
131
-
132
-
133
-
134
-
135
-
136
-
137
-
138
-
139
-
140
-
141
-
142
-
143
-
144
-
145
-
146
-
147
-
148
-
149
-
150
-
151
-
152
-
153
-
154
-
155
-
156
-
157
-
158
-
159
-
160
-
161
-
162
-
163
-
164
-
165
-
166
-
167
-
168
-
169
-
170
-
 171
171 -
 172
172 -
 173
173 -
 174
174 -
 175
175 -
 176
176 -
 177
177 -
 178
178 -
 179
179 -
 180
180 -
 181
181 -
182
-
183
-
184
-
185
-
186
-
187
-
188
-
189
-
190
-
191
-
192
-
193
-
194
-
195
-
196
-
197
-
198
-
199
-
200
-
201
-
202
-
203
-
204
-
205
-
206
-
207
-
208
-
209
-
210
-
211
-
212
-
213
-
214
 |
 |