Dell PowerConnect W-IAP92 Dell Instant 6.1.3.1-3.0.0.0 User Guide - Page 179
Usage Trends, Table 27
 |
View all Dell PowerConnect W-IAP92 manuals
Add to My Manuals
Save this manual to your list of manuals |
Page 179 highlights
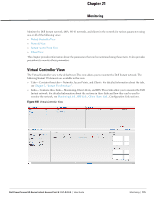
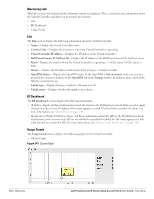
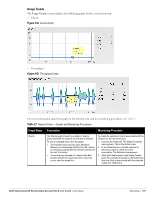
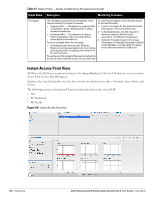
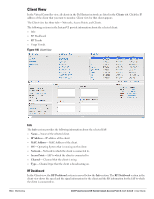
Usage Trends The Usage Trends section displays the following graphs for the selected network: Clients Figure 144 Clients Graph Throughput Figure 145 Throughput Graph For more information about the graphs in the network view and for monitoring procedures, see Table 27. Table 27 Network View - Graphs and Monitoring Procedures Graph Name Description Monitoring Procedure Clients The Clients graph shows the number of clients associated with the network for the last 15 minutes. To see an enlarged view, click the graph. The enlarged view provides Last, Minimum, Maximum, and Average statistics for the number of clients associated with the Virtual Controller for the last 15 minutes. To see the exact number of clients in the Dell Instant network at a particular time, hover the cursor over the graph line. To check the number of clients associated with the network for the last 15 minutes, 1. Log in to the Instant UI. The Virtual Controller view appears. This is the default view. 2. In the Networks tab, click the network for which you want to check the client association. The Network view appears. 3. Study the Clients graph in the Usage Trends pane. For example, the graph on the left shows that one client is associated with the selected network at 12:00 hours Dell PowerConnect W-Series Instant Access Point 6.1.3.1-3.0.0.0 | User Guide Monitoring | 179
-
 1
1 -
2
-
3
-
4
-
5
-
6
-
7
-
8
-
9
-
10
-
11
-
12
-
13
-
14
-
15
-
16
-
17
-
18
-
19
-
20
-
21
-
22
-
23
-
24
-
25
-
26
-
27
-
28
-
29
-
30
-
31
-
32
-
33
-
34
-
35
-
36
-
37
-
38
-
39
-
40
-
41
-
42
-
43
-
44
-
45
-
46
-
47
-
48
-
49
-
50
-
51
-
52
-
53
-
54
-
55
-
56
-
57
-
58
-
59
-
60
-
61
-
62
-
63
-
64
-
65
-
66
-
67
-
68
-
69
-
70
-
71
-
72
-
73
-
74
-
75
-
76
-
77
-
78
-
79
-
80
-
81
-
82
-
83
-
84
-
85
-
86
-
87
-
88
-
89
-
90
-
91
-
92
-
93
-
94
-
95
-
96
-
97
-
98
-
99
-
100
-
101
-
102
-
103
-
104
-
105
-
106
-
107
-
108
-
109
-
110
-
111
-
112
-
113
-
114
-
115
-
116
-
117
-
118
-
119
-
120
-
121
-
122
-
123
-
124
-
125
-
126
-
127
-
128
-
129
-
130
-
131
-
132
-
133
-
134
-
135
-
136
-
137
-
138
-
139
-
140
-
141
-
142
-
143
-
144
-
145
-
146
-
147
-
148
-
149
-
150
-
151
-
152
-
153
-
154
-
155
-
156
-
157
-
158
-
159
-
160
-
161
-
162
-
163
-
164
-
165
-
166
-
167
-
168
-
169
-
170
-
171
-
172
-
173
-
 174
174 -
 175
175 -
 176
176 -
 177
177 -
 178
178 -
 179
179 -
 180
180 -
 181
181 -
 182
182 -
 183
183 -
 184
184 -
185
-
186
-
187
-
188
-
189
-
190
-
191
-
192
-
193
-
194
-
195
-
196
-
197
-
198
-
199
-
200
-
201
-
202
-
203
-
204
-
205
-
206
-
207
-
208
-
209
-
210
-
211
-
212
-
213
-
214
 |
 |
