Dell PowerConnect W-IAP92 Dell Instant 6.1.3.1-3.0.0.0 User Guide - Page 36
Usage Trends, Signal
 |
View all Dell PowerConnect W-IAP92 manuals
Add to My Manuals
Save this manual to your list of manuals |
Page 36 highlights
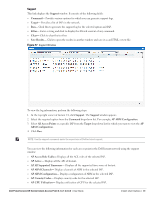
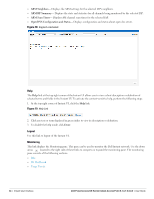
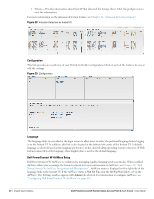
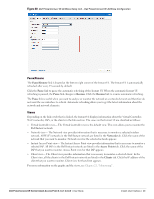
Orange- Signal strength is between 15-20 decibels. Red- Signal strength is less than 15 decibels. To view the signal graph for a client, click on the signal bar against the client in the Signal column. Speed- Displays the data transfer speed of the client. Depending on the data transfer speed of the client, the color of the Signal bar changes from Green > Orange > Red. Green- Data transfer speed is more than 50 percent of the maximum speed supported by the client. Orange- Data transfer speed is between 25-50 percent of the maximum speed supported by the client. Red- Data transfer speed is less than 25 percent of the maximum speed supported by the client. To view the data transfer speed graph of a client, click on the speed icon against the client in the Speed column. Access Points- Lists the IAPs whose utilization, noise, or errors are not within the specified threshold. The IAP names appear as links. When the IAP is clicked, the IAP configuration information is displayed in the Info section. The RF Dashboard section is pushed to the bottom left corner of the Instant UI. The RF Trends section appears in its place. This section consists of the Utilization, Band frames, Noise Floor, and Errors graphs. For more information on the graphs, see Chapter 21, "Monitoring" . Utilization- Displays the radio utilization rate of the IAPs. Depending on the percentage of utilization, the color of the lines on the Utilization icon changes from Green > Orange > Red. Green- Utilization is less than 50 percent. Orange- Utilization is between 50-75 percent. Red- Utilization is more than 75 percent. To view the utilization graph of an IAP, click on the Utilization icon against the IAP in the Utilization column. Noise- Displays the noise floor of the IAPs. Noise is measured in decibels/meter. Depending on the noise floor, the color of the lines on the Noise icon changes from Green > Orange > Red. Green- Noise floor is more than 87dBm. Orange- Noise floor is between 80dBm-87dBm. Red- Noise floor is less than 80dBm. To view the noise floor graph of an IAP, click on the noise icon against the IAP in the Noise column. Errors- Displays the errors for the IAPs. Depending on the errors, color of the lines on the Errors icon changes from Green > Yellow > Red. Green- Errors are less than 5000 frames per second. Orange- Errors are between 5000-10000 frames per second. Red- Errors are more than 10000 frames per second. To view the errors graph of an IAP, click on the Errors icon against the IAP in the Errors column. Usage Trends Displays the following graphs: Clients- In the default Virtual Controller view, the Clients graph displays the number of clients that were associated with the Virtual Controller in the last 15 minutes. In Network or IAP view, this graph displays the number of clients that were associated with the selected network or IAP in the last 15 minutes. Throughput- In the default Virtual Controller view, the Throughput graph displays the incoming and outgoing throughput traffic for the Virtual Controller in the last 15 minutes. In the Network or IAP view, this graph displays the incoming and outgoing throughput traffic for the selected network or IAP in the last 15 minutes. 36 | Instant User Interface Dell PowerConnect W-Series Instant Access Point 6.1.3.1-3.0.0.0 | User Guide
-
 1
1 -
2
-
3
-
4
-
5
-
6
-
7
-
8
-
9
-
10
-
11
-
12
-
13
-
14
-
15
-
16
-
17
-
18
-
19
-
20
-
21
-
22
-
23
-
24
-
25
-
26
-
27
-
28
-
29
-
30
-
 31
31 -
 32
32 -
 33
33 -
 34
34 -
 35
35 -
 36
36 -
 37
37 -
 38
38 -
 39
39 -
 40
40 -
 41
41 -
42
-
43
-
44
-
45
-
46
-
47
-
48
-
49
-
50
-
51
-
52
-
53
-
54
-
55
-
56
-
57
-
58
-
59
-
60
-
61
-
62
-
63
-
64
-
65
-
66
-
67
-
68
-
69
-
70
-
71
-
72
-
73
-
74
-
75
-
76
-
77
-
78
-
79
-
80
-
81
-
82
-
83
-
84
-
85
-
86
-
87
-
88
-
89
-
90
-
91
-
92
-
93
-
94
-
95
-
96
-
97
-
98
-
99
-
100
-
101
-
102
-
103
-
104
-
105
-
106
-
107
-
108
-
109
-
110
-
111
-
112
-
113
-
114
-
115
-
116
-
117
-
118
-
119
-
120
-
121
-
122
-
123
-
124
-
125
-
126
-
127
-
128
-
129
-
130
-
131
-
132
-
133
-
134
-
135
-
136
-
137
-
138
-
139
-
140
-
141
-
142
-
143
-
144
-
145
-
146
-
147
-
148
-
149
-
150
-
151
-
152
-
153
-
154
-
155
-
156
-
157
-
158
-
159
-
160
-
161
-
162
-
163
-
164
-
165
-
166
-
167
-
168
-
169
-
170
-
171
-
172
-
173
-
174
-
175
-
176
-
177
-
178
-
179
-
180
-
181
-
182
-
183
-
184
-
185
-
186
-
187
-
188
-
189
-
190
-
191
-
192
-
193
-
194
-
195
-
196
-
197
-
198
-
199
-
200
-
201
-
202
-
203
-
204
-
205
-
206
-
207
-
208
-
209
-
210
-
211
-
212
-
213
-
214
 |
 |
