Dell PowerConnect W-IAP92 Dell Instant 6.1.3.1-3.0.0.0 User Guide - Page 187
Table 30, Client View - RF Trends Graphs and Monitoring Procedures
 |
View all Dell PowerConnect W-IAP92 manuals
Add to My Manuals
Save this manual to your list of manuals |
Page 187 highlights
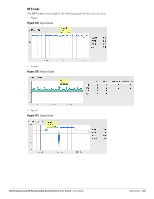
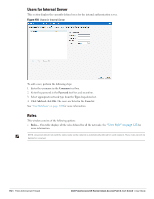
Table 30 Client View - RF Trends Graphs and Monitoring Procedures (Continued) Graph Name Description Monitoring Procedure Speed Throughput The Speed graph shows the data transfer speed for the client. Data transfer is measured in Mega bits per second (mbps). To see an enlarged view, click the graph. The enlarged view shows Last, Minimum, Maximum, and Average statistics for the client for the last 15 minutes. To see the exact speed at a particular time, hover the cursor over the graph line. To monitor the speed for the client for the last 15 minutes, 1. Log in to the Instant UI. The Virtual Controller view appears. This is the default view. 2. In the Clients tab, click the IP address of the client for which you want to monitor the speed. The client view appears. 3. Study the Speed graph in the RF Trends pane. For example, the graph on the left shows that the data transfer speed at 12:26 hours is 240 mbps. The Throughput Graph shows the throughput for the selected client for the last 15 minutes. Outgoing traffic - Throughput for outgoing traffic is displayed in green. Outgoing traffic is shown above the median line. Incoming traffic - Throughput for incoming traffic is displayed in blue. Incoming traffic is shown below the median line. To see an enlarged view, click the graph. The enlarged view shows Last, Minimum, Maximum, and Average statistics for the incoming and outgoing traffic throughput of the client for the last 15 minutes. To see the exact throughput at a particular time, hover the cursor over the graph line. To monitor the errors for the client for the last 15 minutes, 1. Log in to the Instant UI. The Virtual Controller view appears. This is the default view. 2. In the Clients tab, click the IP address of the client for which you want to monitor the throughput. The client view appears. 3. Study the Throughput graph in the RF Trends pane. For example, the graph on the left shows 1.0 kbps outgoing traffic throughput for the client at 12:30 hours. Dell PowerConnect W-Series Instant Access Point 6.1.3.1-3.0.0.0 | User Guide Monitoring | 187
-
 1
1 -
2
-
3
-
4
-
5
-
6
-
7
-
8
-
9
-
10
-
11
-
12
-
13
-
14
-
15
-
16
-
17
-
18
-
19
-
20
-
21
-
22
-
23
-
24
-
25
-
26
-
27
-
28
-
29
-
30
-
31
-
32
-
33
-
34
-
35
-
36
-
37
-
38
-
39
-
40
-
41
-
42
-
43
-
44
-
45
-
46
-
47
-
48
-
49
-
50
-
51
-
52
-
53
-
54
-
55
-
56
-
57
-
58
-
59
-
60
-
61
-
62
-
63
-
64
-
65
-
66
-
67
-
68
-
69
-
70
-
71
-
72
-
73
-
74
-
75
-
76
-
77
-
78
-
79
-
80
-
81
-
82
-
83
-
84
-
85
-
86
-
87
-
88
-
89
-
90
-
91
-
92
-
93
-
94
-
95
-
96
-
97
-
98
-
99
-
100
-
101
-
102
-
103
-
104
-
105
-
106
-
107
-
108
-
109
-
110
-
111
-
112
-
113
-
114
-
115
-
116
-
117
-
118
-
119
-
120
-
121
-
122
-
123
-
124
-
125
-
126
-
127
-
128
-
129
-
130
-
131
-
132
-
133
-
134
-
135
-
136
-
137
-
138
-
139
-
140
-
141
-
142
-
143
-
144
-
145
-
146
-
147
-
148
-
149
-
150
-
151
-
152
-
153
-
154
-
155
-
156
-
157
-
158
-
159
-
160
-
161
-
162
-
163
-
164
-
165
-
166
-
167
-
168
-
169
-
170
-
171
-
172
-
173
-
174
-
175
-
176
-
177
-
178
-
179
-
180
-
181
-
 182
182 -
 183
183 -
 184
184 -
 185
185 -
 186
186 -
 187
187 -
 188
188 -
 189
189 -
 190
190 -
 191
191 -
 192
192 -
193
-
194
-
195
-
196
-
197
-
198
-
199
-
200
-
201
-
202
-
203
-
204
-
205
-
206
-
207
-
208
-
209
-
210
-
211
-
212
-
213
-
214
 |
 |