Uniden BCD325P2 Owners Manual - Page 88
Using Band Scope Mode
 |
View all Uniden BCD325P2 manuals
Add to My Manuals
Save this manual to your list of manuals |
Page 88 highlights
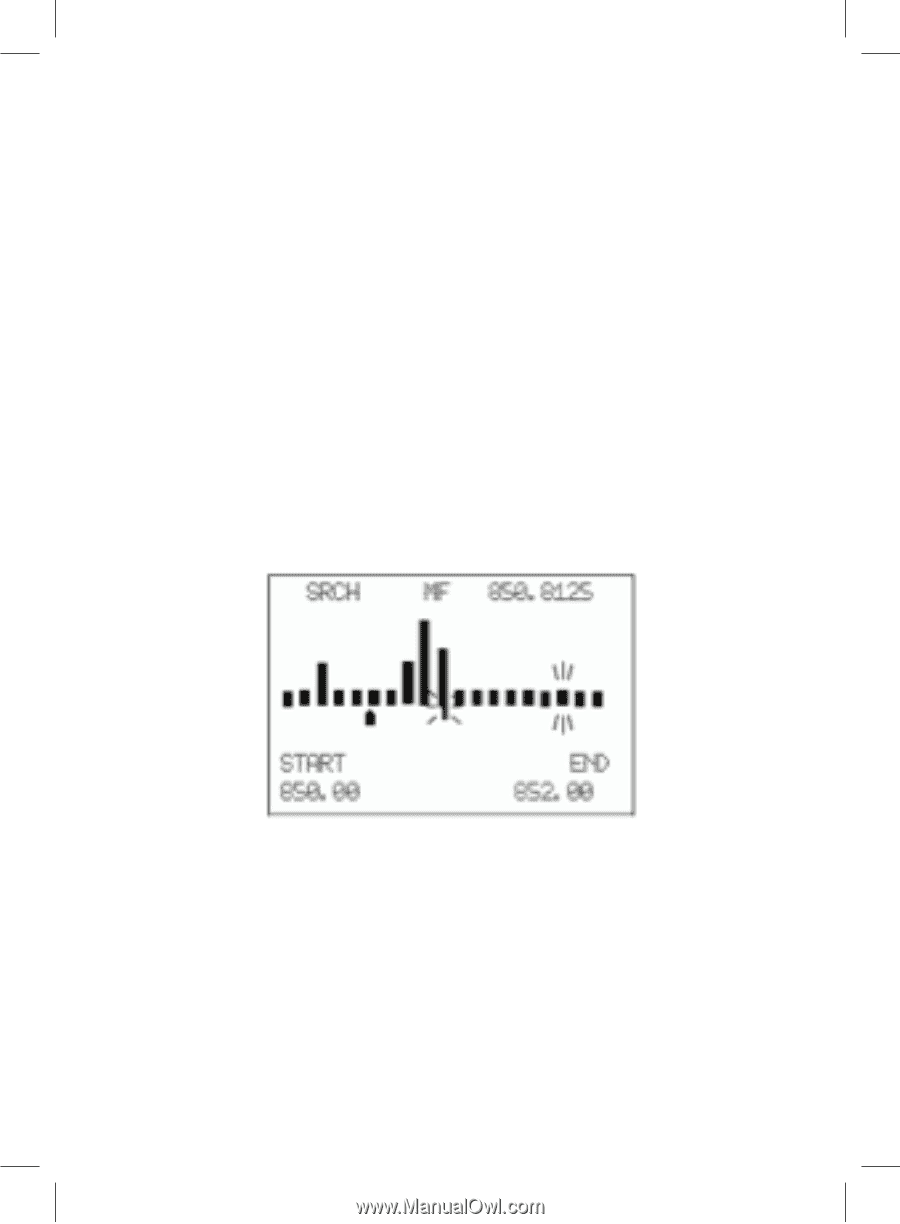
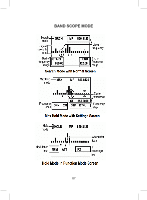
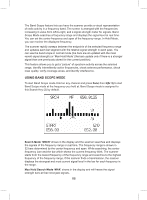
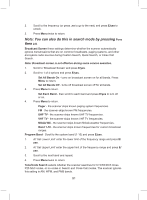
The Band Scope feature lets you have the scanner provide a visual representation of radio activity in a frequency band. The screen is arranged with the frequencies increasing in value from left-to-right, and a signal strength meter for signals. Band Scope Mode searches a frequency range and displays the signal level in real time. You can set the center frequency and span of the frequency range. In Hold Mode, you can monitor the displayed frequency. The scanner rapidly sweeps between the endpoints of the selected frequency range and updates each bar segment with the relative signal strength in each pass. You can use the band scope in normal mode (the bars are all updated with the most recent signal strength) or 'Max Hold Mode' (the bars update only if there is a stronger signal than one previously stored for the current position). This feature allows you to get a "picture" of spectrum activity across the selected range, identify intermittently active frequencies, check antenna performance, check coax quality, verify coverage areas, and identify interference. USING BAND SCOPE MODE To start Band Scope mode Hold on any channel and press Func then 3(Sr 3) to start Band Scope mode at the frequency you held at. Band Scope mode is assigned to this Search Key (3) by default. Search Mode 'SRCH' shows in the display and the scanner searches and displays the signals of the frequency range in real time. The frequency range is shown in 32 bars determined by the center frequency and span. While searching, the center frequency icon and the bar which shows the current frequency blink. The scanner starts from the lowest frequency of the frequency range and searches to the highest frequency of the frequency range. If the scanner finds a transmission, the scanner displays the strongest and most current signal level in the bar for each frequency in the range. Max Hold Search Mode 'MAX' shows in the display and will freeze the signal strength bars at their strongest signals. 88
-
 1
1 -
2
-
3
-
4
-
5
-
6
-
7
-
8
-
9
-
10
-
11
-
12
-
13
-
14
-
15
-
16
-
17
-
18
-
19
-
20
-
21
-
22
-
23
-
24
-
25
-
26
-
27
-
28
-
29
-
30
-
31
-
32
-
33
-
34
-
35
-
36
-
37
-
38
-
39
-
40
-
41
-
42
-
43
-
44
-
45
-
46
-
47
-
48
-
49
-
50
-
51
-
52
-
53
-
54
-
55
-
56
-
57
-
58
-
59
-
60
-
61
-
62
-
63
-
64
-
65
-
66
-
67
-
68
-
69
-
70
-
71
-
72
-
73
-
74
-
75
-
76
-
77
-
78
-
79
-
80
-
81
-
82
-
 83
83 -
 84
84 -
 85
85 -
 86
86 -
 87
87 -
 88
88 -
 89
89 -
 90
90 -
 91
91 -
 92
92 -
 93
93 -
94
-
95
-
96
-
97
-
98
-
99
-
100
-
101
-
102
-
103
-
104
-
105
-
106
-
107
-
108
-
109
-
110
-
111
-
112
-
113
-
114
-
115
-
116
-
117
-
118
-
119
-
120
-
121
-
122
-
123
-
124
-
125
-
126
-
127
-
128
-
129
-
130
-
131
-
132
 |
 |