HP StorageWorks MSA 2/8 HP StorageWorks Fabric OS 3.X Document Addendum (AA-RW - Page 14
Using ISL Monitoring, Displaying ISL Monitors
 |
View all HP StorageWorks MSA 2/8 manuals
Add to My Manuals
Save this manual to your list of manuals |
Page 14 highlights
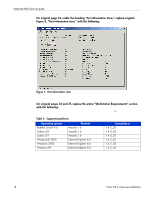
Advanced performance monitor user guide On page 37, at the end of Chapter 3, add the following: Using ISL Monitoring Note: ISL monitoring is supported only in Fabric OS v3.2.x. ISL monitoring measures the amount of traffic each destination domain contributes to the overall traffic. If ISL monitors exceed 16 domains on a single trunk, approximate values are estimated. An ISL is considered a single entity even if it is a trunk or a single E_Port. If a trunk is to be monitored, the master trunk port is used to identify the ISL. The ISL monitor is discontinued when the master trunk port goes offline. ISL monitoring is enabled by default, except when using HP Fabric Manager, for which ISL monitoring must be enabled on a per-switch basis. For more information, refer to the HP StorageWorks Fabric Manager User Guide. You can display existing ISL monitors using the perfMonitorShow command. You can clear ISL monitor counters using the perfMonitorClear command. Displaying ISL Monitors Use the perfMonitorShow command to display all the ISL-based monitors on a specified port. This command displays the following information: ■ 64-bit cumulative ISL transmit counter ■ 64-bit cumulative transmit counter for each individual domain ■ Total number of domains being monitored ■ Number of ports in the ISL The following example displays ISL monitors on port 7. In the example, there is one port in the ISL. Sixteen domains are monitored because there are routes going to those domains through this ISL switch:admin> perfmonitorshow "ISL", 7 Total transmit count for this ISL: 21748 g 780204495 Number of destination domains monitored: 16 Number of ports in this ISL: 1 Domain 84: 0 Domain 88: Domain 89: 0 Domain 90: Domain 91: 0 Domain 92: Domain 95: 21748 g 780182720 Domain 96: Domain 100: 36 Domain 102: Domain 105: 0 Domain 110: Domain 80: 112 Domain 81: Domain 82: 112 Domain 83: 0 0 0 104 0 0 21299 112 14 Fabric OS 3.x Document Addendum
-
 1
1 -
2
-
3
-
4
-
5
-
6
-
7
-
8
-
 9
9 -
 10
10 -
 11
11 -
 12
12 -
 13
13 -
 14
14 -
 15
15 -
 16
16 -
 17
17 -
 18
18 -
 19
19 -
20
-
21
-
22
-
23
-
24
-
25
-
26
-
27
-
28
-
29
-
30
-
31
-
32
-
33
-
34
-
35
-
36
-
37
-
38
-
39
-
40
-
41
-
42
-
43
-
44
-
45
-
46
-
47
-
48
-
49
-
50
-
51
-
52
-
53
-
54
-
55
-
56
-
57
-
58
-
59
-
60
-
61
-
62
-
63
-
64
-
65
-
66
-
67
-
68
-
69
-
70
-
71
-
72
-
73
-
74
-
75
-
76
-
77
-
78
-
79
-
80
-
81
-
82
-
83
-
84
-
85
-
86
-
87
-
88
-
89
-
90
-
91
-
92
-
93
-
94
-
95
-
96
-
97
-
98
-
99
-
100
-
101
-
102
-
103
-
104
-
105
-
106
-
107
-
108
-
109
-
110
-
111
-
112
-
113
-
114
-
115
-
116
-
117
-
118
-
119
-
120
-
121
-
122
-
123
-
124
-
125
-
126
-
127
-
128
-
129
-
130
-
131
-
132
-
133
-
134
-
135
-
136
-
137
-
138
-
139
-
140
-
141
-
142
-
143
-
144
-
145
-
146
-
147
-
148
-
149
-
150
-
151
-
152
-
153
-
154
-
155
-
156
-
157
-
158
-
159
-
160
-
161
-
162
-
163
-
164
-
165
-
166
-
167
-
168
-
169
-
170
-
171
-
172
-
173
-
174
-
175
-
176
-
177
-
178
-
179
-
180
-
181
-
182
-
183
-
184
-
185
-
186
-
187
-
188
-
189
-
190
-
191
-
192
-
193
-
194
-
195
-
196
-
197
-
198
-
199
-
200
-
201
-
202
-
203
-
204
-
205
-
206
-
207
-
208
-
209
-
210
-
211
-
212
-
213
-
214
-
215
-
216
-
217
-
218
-
219
-
220
-
221
-
222
-
223
-
224
-
225
-
226
-
227
-
228
-
229
-
230
-
231
-
232
-
233
-
234
-
235
-
236
-
237
-
238
-
239
-
240
-
241
-
242
-
243
-
244
-
245
-
246
-
247
-
248
-
249
-
250
 |
 |