HP StorageWorks MSA 2/8 HP StorageWorks Fabric OS 3.X Document Addendum (AA-RW - Page 239
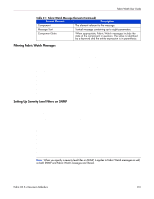
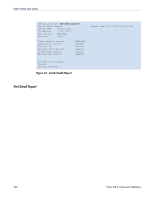
Fabric Watch User Guide, Fabric Watch Reports, Switch Health Report, Fabric Watch Message Formats
 |
View all HP StorageWorks MSA 2/8 manuals
Add to My Manuals
Save this manual to your list of manuals |
Page 239 highlights
Fabric Watch User Guide 9 This chapter contains updates to the HP StorageWorks Fabric Watch Version 3.1.x/4.1.x User Guide, part number AA-RTSGC-AA. On page 26, following the section "Activating with Web Tools," add the following: Fabric Watch Reports You can run reporting commands in Fabric Watch to get instant access to switch information. Although the switchshow command provides basic switch information, Fabric Watch reports provide detailed information and enable you to track marginal or faulty ports that can affect throughput or switch performance. You can run reports on the command line using a telnet session or by using Advanced Web Tools (if you have installed a Web Tools license). Both tools generate reports that contain the same information, but it is presented differently. Switch Health Report The switch health report summarizes the overall health of a switch at a particular instant. The report lists: ■ Current health of each port, based on the currently configured policy settings. ■ High-level state of the switch, as well as its power supplies, fans, and temperatures. ■ All ports that are in an abnormal state. The switch health report is available even without Fabric Watch, but for licensed Fabric Watch users, the marginal and faulty ports are included in the report. The following is an example of a switch health report. On page 114, preceding the section "Environmental Class Messages" add the following information: Fabric Watch Message Formats The format of all Fabric Watch messages is changed to a standard format that includes a unique message number. Fabric Watch also assigns a severity level to each message to indicate the degree of severity. Fabric OS 3.x Document Addendum 239
-
 1
1 -
2
-
3
-
4
-
5
-
6
-
7
-
8
-
9
-
10
-
11
-
12
-
13
-
14
-
15
-
16
-
17
-
18
-
19
-
20
-
21
-
22
-
23
-
24
-
25
-
26
-
27
-
28
-
29
-
30
-
31
-
32
-
33
-
34
-
35
-
36
-
37
-
38
-
39
-
40
-
41
-
42
-
43
-
44
-
45
-
46
-
47
-
48
-
49
-
50
-
51
-
52
-
53
-
54
-
55
-
56
-
57
-
58
-
59
-
60
-
61
-
62
-
63
-
64
-
65
-
66
-
67
-
68
-
69
-
70
-
71
-
72
-
73
-
74
-
75
-
76
-
77
-
78
-
79
-
80
-
81
-
82
-
83
-
84
-
85
-
86
-
87
-
88
-
89
-
90
-
91
-
92
-
93
-
94
-
95
-
96
-
97
-
98
-
99
-
100
-
101
-
102
-
103
-
104
-
105
-
106
-
107
-
108
-
109
-
110
-
111
-
112
-
113
-
114
-
115
-
116
-
117
-
118
-
119
-
120
-
121
-
122
-
123
-
124
-
125
-
126
-
127
-
128
-
129
-
130
-
131
-
132
-
133
-
134
-
135
-
136
-
137
-
138
-
139
-
140
-
141
-
142
-
143
-
144
-
145
-
146
-
147
-
148
-
149
-
150
-
151
-
152
-
153
-
154
-
155
-
156
-
157
-
158
-
159
-
160
-
161
-
162
-
163
-
164
-
165
-
166
-
167
-
168
-
169
-
170
-
171
-
172
-
173
-
174
-
175
-
176
-
177
-
178
-
179
-
180
-
181
-
182
-
183
-
184
-
185
-
186
-
187
-
188
-
189
-
190
-
191
-
192
-
193
-
194
-
195
-
196
-
197
-
198
-
199
-
200
-
201
-
202
-
203
-
204
-
205
-
206
-
207
-
208
-
209
-
210
-
211
-
212
-
213
-
214
-
215
-
216
-
217
-
218
-
219
-
220
-
221
-
222
-
223
-
224
-
225
-
226
-
227
-
228
-
229
-
230
-
231
-
232
-
233
-
 234
234 -
 235
235 -
 236
236 -
 237
237 -
 238
238 -
 239
239 -
 240
240 -
 241
241 -
 242
242 -
 243
243 -
 244
244 -
245
-
246
-
247
-
248
-
249
-
250
 |
 |