HP StorageWorks MSA 2/8 HP StorageWorks Fabric OS 3.X Document Addendum (AA-RW - Page 241
Filtering Fabric Watch Messages, Setting Up Severity Level Filters on SNMP, command
 |
View all HP StorageWorks MSA 2/8 manuals
Add to My Manuals
Save this manual to your list of manuals |
Page 241 highlights
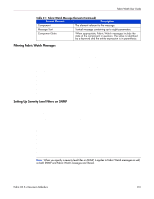
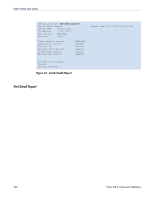
Fabric Watch User Guide Table 21: Fabric Watch Message Elements (Continued) Format Element Description Component The element relevant to the message. Message Text Textual message containing up to eight parameters. Component State When appropriate, Fabric Watch messages include the state of the component in question. The value is identified by a keyword and the entire expression is in parenthesis. Filtering Fabric Watch Messages Fabric Watch assigns a severity level to each message when it is produced. You can set a filter so that only messages of a particular severity level and above are sent to the system and error logs. For example, if the level is set to Warning, only Warning, Error, and Critical messages are displayed and logged. Filtered messages are not shown on the console. To filter Fabric Watch messages, issue the fwset --message command, and specify an integer that corresponds to one of the following Fabric Watch severity levels: ■ Debug - 5 ■ Info - 4 ■ Warning - 3 ■ Error - 2 ■ Critical - 1 To view the current filter level setting for Fabric Watch, issue the fwshow --message command. Setting Up Severity Level Filters on SNMP Using the agtcfgset command, you can specify a trap recipient severity level filter on SNMP. The trap severity level is associated with each trap recipient's IP address. After specifying the IP address, specify the severity level for an event. That IP address (and only that IP address) then receives notifications when the severity level for that event is reached or surpassed. You do receive notifications unless the error matches or surpasses the specified severity level. The severity level values for the traps are: ■ None - 0 ■ Debug - 5 ■ Info - 4 ■ Warning - 3 ■ Error - 2 ■ Critical - 1 Note: When you specify a severity level filter on SNMP, it applies to Fabric Watch messages as well, so both SNMP and Fabric Watch messages are filtered. Fabric OS 3.x Document Addendum 241
-
 1
1 -
2
-
3
-
4
-
5
-
6
-
7
-
8
-
9
-
10
-
11
-
12
-
13
-
14
-
15
-
16
-
17
-
18
-
19
-
20
-
21
-
22
-
23
-
24
-
25
-
26
-
27
-
28
-
29
-
30
-
31
-
32
-
33
-
34
-
35
-
36
-
37
-
38
-
39
-
40
-
41
-
42
-
43
-
44
-
45
-
46
-
47
-
48
-
49
-
50
-
51
-
52
-
53
-
54
-
55
-
56
-
57
-
58
-
59
-
60
-
61
-
62
-
63
-
64
-
65
-
66
-
67
-
68
-
69
-
70
-
71
-
72
-
73
-
74
-
75
-
76
-
77
-
78
-
79
-
80
-
81
-
82
-
83
-
84
-
85
-
86
-
87
-
88
-
89
-
90
-
91
-
92
-
93
-
94
-
95
-
96
-
97
-
98
-
99
-
100
-
101
-
102
-
103
-
104
-
105
-
106
-
107
-
108
-
109
-
110
-
111
-
112
-
113
-
114
-
115
-
116
-
117
-
118
-
119
-
120
-
121
-
122
-
123
-
124
-
125
-
126
-
127
-
128
-
129
-
130
-
131
-
132
-
133
-
134
-
135
-
136
-
137
-
138
-
139
-
140
-
141
-
142
-
143
-
144
-
145
-
146
-
147
-
148
-
149
-
150
-
151
-
152
-
153
-
154
-
155
-
156
-
157
-
158
-
159
-
160
-
161
-
162
-
163
-
164
-
165
-
166
-
167
-
168
-
169
-
170
-
171
-
172
-
173
-
174
-
175
-
176
-
177
-
178
-
179
-
180
-
181
-
182
-
183
-
184
-
185
-
186
-
187
-
188
-
189
-
190
-
191
-
192
-
193
-
194
-
195
-
196
-
197
-
198
-
199
-
200
-
201
-
202
-
203
-
204
-
205
-
206
-
207
-
208
-
209
-
210
-
211
-
212
-
213
-
214
-
215
-
216
-
217
-
218
-
219
-
220
-
221
-
222
-
223
-
224
-
225
-
226
-
227
-
228
-
229
-
230
-
231
-
232
-
233
-
234
-
235
-
 236
236 -
 237
237 -
 238
238 -
 239
239 -
 240
240 -
 241
241 -
 242
242 -
 243
243 -
 244
244 -
 245
245 -
 246
246 -
247
-
248
-
249
-
250
 |
 |