HP StorageWorks MSA 2/8 HP StorageWorks Fabric OS 3.X Document Addendum (AA-RW - Page 242
Switch Health Report, Port Detail Report, a Fabric Watch licensed product.
 |
View all HP StorageWorks MSA 2/8 manuals
Add to My Manuals
Save this manual to your list of manuals |
Page 242 highlights
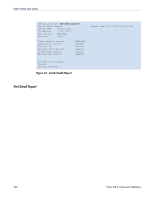
Fabric Watch User Guide Switch1_216:root> switchstatusshow Switch Health Report Switch Name: Switch1_216 IP address: 10.32.170.61 SwitchState: MARGINAL Duration: 119:53 Power supplies monitor Temperatures monitor Fans monitor Marginal ports monitor Faulty ports monitor Missing SFPs monitor MARGINAL HEALTHY HEALTHY HEALTHY HEALTHY HEALTHY Report time: 09/17/2004 9:03:01 PM All ports are healthy value=0 Switch1_216:root> Figure 33: Switch Health Report The final portion of the report, detailing port health, is not available without a Fabric Watch license. Port Detail Report If the switch health report shows marginal throughput or decreased performance, use the port detail report to see statistics about each port. The port detail report conveys the overall health of one port, or a set of ports, at the time it is run. For each port, the port detail report lists the current state of health and all measurements contributing to that state. The port detail report is a Fabric Watch licensed product. Figure 34 shows an example of a port detail report. An X in the column for a condition indicates that the condition has exceeded the threshold; a hyphen ( - ) indicates that the measurement is within range. 242 Fabric OS 3.x Document Addendum
-
 1
1 -
2
-
3
-
4
-
5
-
6
-
7
-
8
-
9
-
10
-
11
-
12
-
13
-
14
-
15
-
16
-
17
-
18
-
19
-
20
-
21
-
22
-
23
-
24
-
25
-
26
-
27
-
28
-
29
-
30
-
31
-
32
-
33
-
34
-
35
-
36
-
37
-
38
-
39
-
40
-
41
-
42
-
43
-
44
-
45
-
46
-
47
-
48
-
49
-
50
-
51
-
52
-
53
-
54
-
55
-
56
-
57
-
58
-
59
-
60
-
61
-
62
-
63
-
64
-
65
-
66
-
67
-
68
-
69
-
70
-
71
-
72
-
73
-
74
-
75
-
76
-
77
-
78
-
79
-
80
-
81
-
82
-
83
-
84
-
85
-
86
-
87
-
88
-
89
-
90
-
91
-
92
-
93
-
94
-
95
-
96
-
97
-
98
-
99
-
100
-
101
-
102
-
103
-
104
-
105
-
106
-
107
-
108
-
109
-
110
-
111
-
112
-
113
-
114
-
115
-
116
-
117
-
118
-
119
-
120
-
121
-
122
-
123
-
124
-
125
-
126
-
127
-
128
-
129
-
130
-
131
-
132
-
133
-
134
-
135
-
136
-
137
-
138
-
139
-
140
-
141
-
142
-
143
-
144
-
145
-
146
-
147
-
148
-
149
-
150
-
151
-
152
-
153
-
154
-
155
-
156
-
157
-
158
-
159
-
160
-
161
-
162
-
163
-
164
-
165
-
166
-
167
-
168
-
169
-
170
-
171
-
172
-
173
-
174
-
175
-
176
-
177
-
178
-
179
-
180
-
181
-
182
-
183
-
184
-
185
-
186
-
187
-
188
-
189
-
190
-
191
-
192
-
193
-
194
-
195
-
196
-
197
-
198
-
199
-
200
-
201
-
202
-
203
-
204
-
205
-
206
-
207
-
208
-
209
-
210
-
211
-
212
-
213
-
214
-
215
-
216
-
217
-
218
-
219
-
220
-
221
-
222
-
223
-
224
-
225
-
226
-
227
-
228
-
229
-
230
-
231
-
232
-
233
-
234
-
235
-
236
-
 237
237 -
 238
238 -
 239
239 -
 240
240 -
 241
241 -
 242
242 -
 243
243 -
 244
244 -
 245
245 -
 246
246 -
 247
247 -
248
-
249
-
250
 |
 |