HP StorageWorks MSA 2/8 HP StorageWorks Secure Fabric OS V1.0 User Guide (AA-R - Page 92
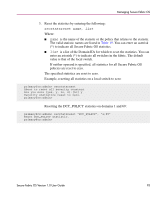
Resetting Secure Fabric OS Statistics, Example
 |
View all HP StorageWorks MSA 2/8 manuals
Add to My Manuals
Save this manual to your list of manuals |
Page 92 highlights
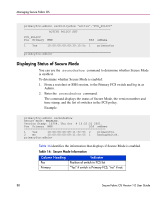
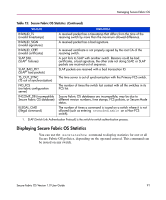
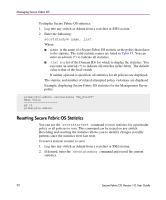
Managing Secure Fabric OS To display Secure Fabric OS statistics: 1. Log into any switch as Admin from a sectelnet or SSH session. 2. Enter the following: secstatsshow name, list Where: ■ name is the name of a Secure Fabric OS statistic or the policy that relates to the statistic. The valid statistic names are listed in Table 15. You can enter an asterisk (*) to indicate all statistics. ■ list is a list of the Domain IDs for which to display the statistics. You can enter an asterisk (*) to indicate all switches in the fabric. The default value is that of the local switch. If neither operand is specified, all statistics for all policies are displayed. The statistic and number of related attempted policy violations are displayed. Example, displaying Secure Fabric OS statistics for the Management Server policy: primaryfcs:admin> secstatsshow "MS_POLICY" Name Value MS 20 primaryfcs:admin> Resetting Secure Fabric OS Statistics You can use the secstatsreset command to reset statistics for a particular policy or all policies to zero. This command can be issued on any switch. Recording and resetting the statistics allows you to identify changes in traffic patterns since the statistics were last reset. To reset a statistic counter to zero: 1. Log into any switch as Admin from a sectelnet or SSH session. 2. If desired, enter the secstatsshow command and record the current statistics. 92 Secure Fabric OS Version 1.0 User Guide
-
 1
1 -
2
-
3
-
4
-
5
-
6
-
7
-
8
-
9
-
10
-
11
-
12
-
13
-
14
-
15
-
16
-
17
-
18
-
19
-
20
-
21
-
22
-
23
-
24
-
25
-
26
-
27
-
28
-
29
-
30
-
31
-
32
-
33
-
34
-
35
-
36
-
37
-
38
-
39
-
40
-
41
-
42
-
43
-
44
-
45
-
46
-
47
-
48
-
49
-
50
-
51
-
52
-
53
-
54
-
55
-
56
-
57
-
58
-
59
-
60
-
61
-
62
-
63
-
64
-
65
-
66
-
67
-
68
-
69
-
70
-
71
-
72
-
73
-
74
-
75
-
76
-
77
-
78
-
79
-
80
-
81
-
82
-
83
-
84
-
85
-
86
-
 87
87 -
 88
88 -
 89
89 -
 90
90 -
 91
91 -
 92
92 -
 93
93 -
 94
94 -
 95
95 -
 96
96 -
 97
97 -
98
-
99
-
100
-
101
-
102
-
103
-
104
-
105
-
106
-
107
-
108
-
109
-
110
-
111
-
112
-
113
-
114
-
115
-
116
-
117
-
118
-
119
-
120
-
121
-
122
-
123
-
124
-
125
-
126
-
127
-
128
-
129
 |
 |