HP StorageWorks 1606 Brocade Fabric Watch Administrator's Guide v6.3.0 (53-100 - Page 26
Fabric Watch overview
 |
View all HP StorageWorks 1606 manuals
Add to My Manuals
Save this manual to your list of manuals |
Page 26 highlights
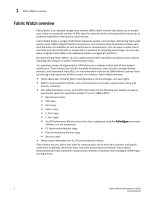
1 Fabric Watch overview Fabric Watch overview Fabric Watch is an optional storage area network (SAN) health monitor that allows you to enable each switch to constantly monitor its SAN fabric for potential faults and automatically alerts you to problems long before they become costly failures. Fabric Watch tracks a variety of SAN fabric elements, events, and counters. Monitoring fabric-wide events, ports, GBICs (Gigabit Interface Converters), and environmental parameters enables early fault detection and isolation as well as performance measurement. You can select custom fabric elements and alert thresholds or choose from a selection of preconfigured settings. You can also easily integrate Fabric Watch with enterprise system management solutions. By implementing Fabric Watch, you can rapidly improve SAN availability and performance without installing new software or system administration tools. For a growing number of organizations, SAN fabrics are a mission-critical part of their system architecture. These fabrics can include hundreds of elements, such as hosts, storage devices, switches, and interswitch links (ISLs). An instrumentation solution for SANs delivers optimal value by tracking a wide spectrum of fabric events. For instance, Fabric Watch monitors: • Fabric resources, including fabric reconfigurations, zoning changes, and new logins. • Switch environmental functions, such as temperature and power supply status, along with security violations. • Port state transitions, errors, and traffic information for the following port classes as well as operational values for supported models of "smart" GBICs/SFPs: • Environment class • SFP class • Port class • Fabric class • E_Port class • F_Port class • AL_PA Performance Monitor class (this class is displayed using the fwConfigure command; however, it is not supported). • EE Performance Monitor class • Filter Performance Monitor class • Security class • Performance information for AL_PA and end-to-end metrics. Fabric Watch lets you define how often to measure each switch and fabric element and specify notification thresholds. Whenever fabric elements exceed these thresholds, Fabric Watch automatically provides notification using several methods, including e-mail messages, SNMP traps, and log entries. 2 Fabric Watch Administrator's Guide 53-1001342-01
-
 1
1 -
2
-
3
-
4
-
5
-
6
-
7
-
8
-
9
-
10
-
11
-
12
-
13
-
14
-
15
-
16
-
17
-
18
-
19
-
20
-
 21
21 -
 22
22 -
 23
23 -
 24
24 -
 25
25 -
 26
26 -
 27
27 -
 28
28 -
 29
29 -
 30
30 -
 31
31 -
32
-
33
-
34
-
35
-
36
-
37
-
38
-
39
-
40
-
41
-
42
-
43
-
44
-
45
-
46
-
47
-
48
-
49
-
50
-
51
-
52
-
53
-
54
-
55
-
56
-
57
-
58
-
59
-
60
-
61
-
62
-
63
-
64
-
65
-
66
-
67
-
68
-
69
-
70
-
71
-
72
-
73
-
74
-
75
-
76
-
77
-
78
-
79
-
80
-
81
-
82
-
83
-
84
-
85
-
86
-
87
-
88
-
89
-
90
-
91
-
92
-
93
-
94
-
95
-
96
-
97
-
98
-
99
-
100
-
101
-
102
-
103
-
104
-
105
-
106
-
107
-
108
-
109
-
110
-
111
-
112
-
113
-
114
-
115
-
116
-
117
-
118
-
119
-
120
-
121
-
122
-
123
-
124
-
125
-
126
-
127
-
128
-
129
-
130
-
131
-
132
-
133
-
134
-
135
-
136
-
137
-
138
 |
 |