HP StorageWorks 1606 Brocade Fabric Watch Administrator's Guide v6.3.0 (53-100 - Page 44
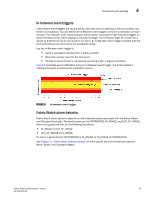
the data sensed falls below the low threshold value or above the high threshold value.
 |
View all HP StorageWorks 1606 manuals
Add to My Manuals
Save this manual to your list of manuals |
Page 44 highlights
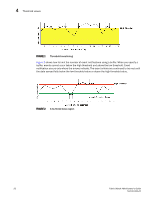
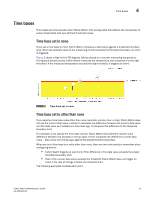
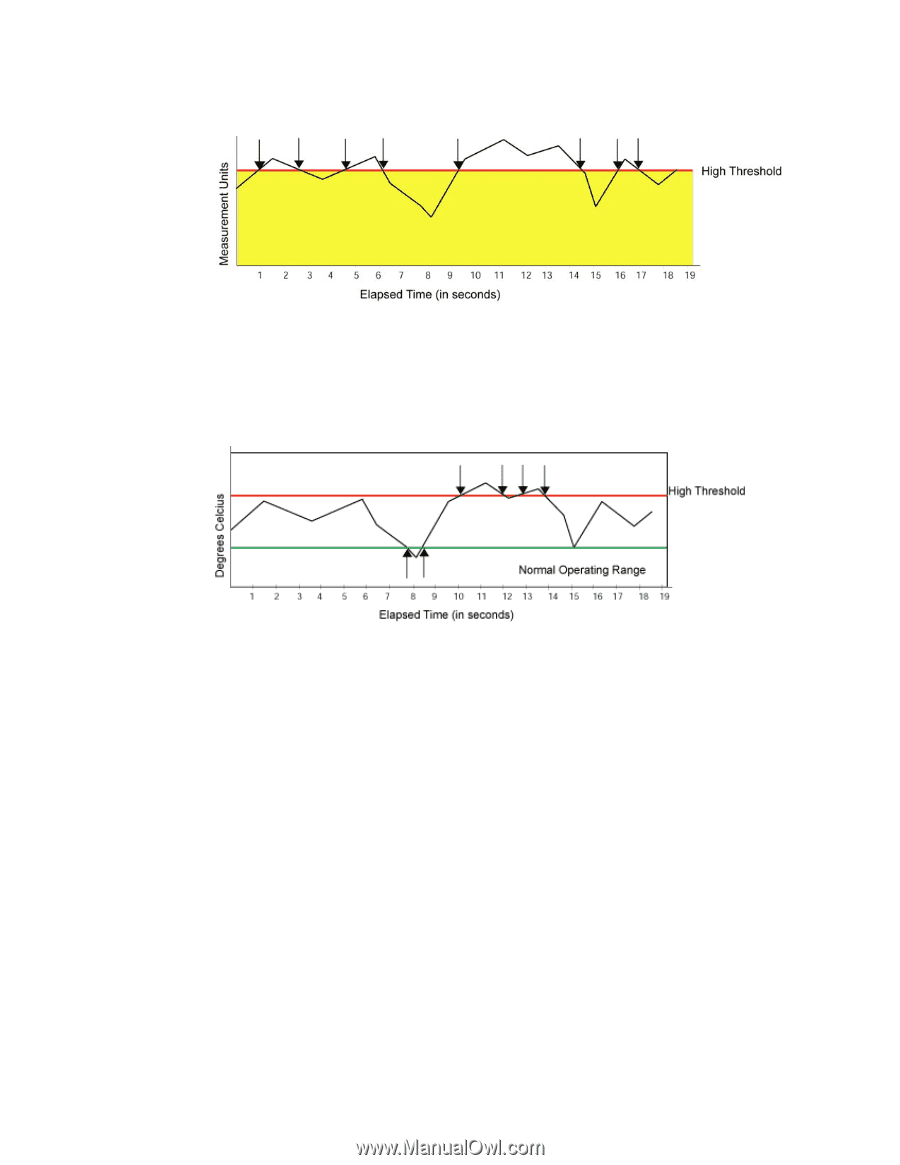
4 Threshold values FIGURE 1 Threshold monitoring Figure 2 shows how to limit the number of event notifications using a buffer. When you specify a buffer, events cannot occur below the high threshold and above the low threshold. Event notification occurs only where the arrows indicate. The event criteria are continued to be met until the data sensed falls below the low threshold value or above the high threshold value. FIGURE 2 A buffered data region 20 Fabric Watch Administrator's Guide 53-1001342-01
-
 1
1 -
2
-
3
-
4
-
5
-
6
-
7
-
8
-
9
-
10
-
11
-
12
-
13
-
14
-
15
-
16
-
17
-
18
-
19
-
20
-
21
-
22
-
23
-
24
-
25
-
26
-
27
-
28
-
29
-
30
-
31
-
32
-
33
-
34
-
35
-
36
-
37
-
38
-
 39
39 -
 40
40 -
 41
41 -
 42
42 -
 43
43 -
 44
44 -
 45
45 -
 46
46 -
 47
47 -
 48
48 -
 49
49 -
50
-
51
-
52
-
53
-
54
-
55
-
56
-
57
-
58
-
59
-
60
-
61
-
62
-
63
-
64
-
65
-
66
-
67
-
68
-
69
-
70
-
71
-
72
-
73
-
74
-
75
-
76
-
77
-
78
-
79
-
80
-
81
-
82
-
83
-
84
-
85
-
86
-
87
-
88
-
89
-
90
-
91
-
92
-
93
-
94
-
95
-
96
-
97
-
98
-
99
-
100
-
101
-
102
-
103
-
104
-
105
-
106
-
107
-
108
-
109
-
110
-
111
-
112
-
113
-
114
-
115
-
116
-
117
-
118
-
119
-
120
-
121
-
122
-
123
-
124
-
125
-
126
-
127
-
128
-
129
-
130
-
131
-
132
-
133
-
134
-
135
-
136
-
137
-
138
 |
 |
20
Fabric Watch Administrator’s Guide
53-1001342-01
Threshold values
4
FIGURE 1
Threshold monitoring
Figure 2
shows how to limit the number of event notifications using a buffer. When you specify a
buffer, events cannot occur below the high threshold and above the low threshold. Event
notification occurs only where the arrows indicate. The event criteria are continued to be met until
the data sensed falls below the low threshold value or above the high threshold value.
FIGURE 2
A buffered data region