HP StorageWorks 1606 Brocade Fabric Watch Administrator's Guide v6.3.0 (53-100 - Page 98
Switch Status Policy report, Generating a Switch Status Policy report
 |
View all HP StorageWorks 1606 manuals
Add to My Manuals
Save this manual to your list of manuals |
Page 98 highlights
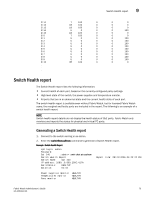
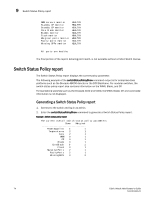
9 Switch Status Policy report WWN servers monitor Standby CP monitor Standby CP monitor Core blade monitor Blades monitor Flash monitor Marginal ports monitor Faulty ports monitor Missing SFPs monitor HEALTHY HEALTHY HEALTHY HEALTHY HEALTHY HEALTHY HEALTHY HEALTHY HEALTHY All ports are healthy The final portion of the report, detailing port health, is not available without a Fabric Watch license. Switch Status Policy report The Switch Status Policy report displays the current policy parameter. The following example of the switchStatusPolicyShow command output is for enterprise-class platforms such as the Brocade 48000 director or the DCX Backbone. For modular switches, the switch status policy report also contains information on the WWN, Blade, and CP. For standalone switches such as the Brocade 4100 and 5000, the WWN, Blade, CP, and core blade information is not displayed. Generating a Switch Status Policy report 1. Connect to the switch and log in as admin. 2. Enter the switchStatusPolicyShow command to generate a Switch Status Policy report. Example : Switch status policy report The current overall switch status policy parameters: Down Marginal PowerSupplies 2 1 Temperatures 2 1 Fans 2 1 WWN 0 1 CP 0 1 Blade 0 1 CoreBlade 0 1 Flash 0 1 MarginalPorts 2 1 FaultyPorts 2 1 MissingSFPs 0 0 74 Fabric Watch Administrator's Guide 53-1001342-01
-
 1
1 -
2
-
3
-
4
-
5
-
6
-
7
-
8
-
9
-
10
-
11
-
12
-
13
-
14
-
15
-
16
-
17
-
18
-
19
-
20
-
21
-
22
-
23
-
24
-
25
-
26
-
27
-
28
-
29
-
30
-
31
-
32
-
33
-
34
-
35
-
36
-
37
-
38
-
39
-
40
-
41
-
42
-
43
-
44
-
45
-
46
-
47
-
48
-
49
-
50
-
51
-
52
-
53
-
54
-
55
-
56
-
57
-
58
-
59
-
60
-
61
-
62
-
63
-
64
-
65
-
66
-
67
-
68
-
69
-
70
-
71
-
72
-
73
-
74
-
75
-
76
-
77
-
78
-
79
-
80
-
81
-
82
-
83
-
84
-
85
-
86
-
87
-
88
-
89
-
90
-
91
-
92
-
 93
93 -
 94
94 -
 95
95 -
 96
96 -
 97
97 -
 98
98 -
 99
99 -
 100
100 -
 101
101 -
 102
102 -
 103
103 -
104
-
105
-
106
-
107
-
108
-
109
-
110
-
111
-
112
-
113
-
114
-
115
-
116
-
117
-
118
-
119
-
120
-
121
-
122
-
123
-
124
-
125
-
126
-
127
-
128
-
129
-
130
-
131
-
132
-
133
-
134
-
135
-
136
-
137
-
138
 |
 |