HP StorageWorks 1606 Brocade Fabric Watch Administrator's Guide v6.3.0 (53-100 - Page 61
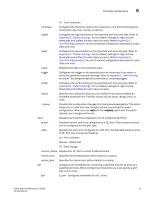
Fabric Watch components, shows the monitored elements in the RXPerformance area menu.
 |
View all HP StorageWorks 1606 manuals
Add to My Manuals
Save this manual to your list of manuals |
Page 61 highlights
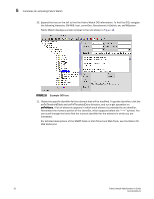
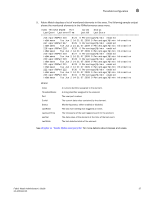
Threshold configuration 6 5. Fabric Watch displays a list of monitored elements in this area. The following sample output shows the monitored elements in the RXPerformance area menu. Index ThresholdName Port CurVal Status LastEvent LasteventTime LastVal LastState 216 eportRXPerf216 8/24 0 Percentage(%)/min enabled inBetween Tue Jun 2 14:21:01 2009 0 Percentage(%)/min Informative 217 eportRXPerf217 8/25 0 Percentage(%)/min enabled inBetween Tue Jun 2 14:21:07 2009 0 Percentage(%)/min Informative 218 eportRXPerf218 8/26 0 Percentage(%)/min enabled inBetween Tue Jun 2 14:21:07 2009 0 Percentage(%)/min Informative 219 eportRXPerf219 8/27 0 Percentage(%)/min enabled inBetween Tue Jun 2 14:21:07 2009 0 Percentage(%)/min Informative 220 eportRXPerf220 8/28 0 Percentage(%)/min enabled inBetween Tue Jun 2 14:21:07 2009 0 Percentage(%)/min Informative 221 eportRXPerf221 8/29 0 Percentage(%)/min enabled inBetween Tue Jun 2 14:21:07 2009 0 Percentage(%)/min Informative 222 eportRXPerf222 8/30 0 Percentage(%)/min enabled inBetween Tue Jun 2 14:21:07 2009 0 Percentage(%)/min Informative 223 eportRXPerf223 8/31 0 Percentage(%)/min enabled inBetween Tue Jun 2 14:21:07 2009 0 Percentage(%)/min Informative where: Index ThresholdName Port CurVal Status LastEvent LasteventTime LastVal LastState A numeric identifier assigned to the element. A string identifier assigned to the element. The user port number. The current data value contained by the element. Monitoring status, either enabled or disabled. The last event setting that triggered an event. The timestamp of the last triggered event for the element. The data value of the element at the time of the last event. The last detected state of the element. See Chapter 3, "Fabric Watch components" for more details about classes and areas. Fabric Watch Administrator's Guide 37 53-1001342-01
-
 1
1 -
2
-
3
-
4
-
5
-
6
-
7
-
8
-
9
-
10
-
11
-
12
-
13
-
14
-
15
-
16
-
17
-
18
-
19
-
20
-
21
-
22
-
23
-
24
-
25
-
26
-
27
-
28
-
29
-
30
-
31
-
32
-
33
-
34
-
35
-
36
-
37
-
38
-
39
-
40
-
41
-
42
-
43
-
44
-
45
-
46
-
47
-
48
-
49
-
50
-
51
-
52
-
53
-
54
-
55
-
 56
56 -
 57
57 -
 58
58 -
 59
59 -
 60
60 -
 61
61 -
 62
62 -
 63
63 -
 64
64 -
 65
65 -
 66
66 -
67
-
68
-
69
-
70
-
71
-
72
-
73
-
74
-
75
-
76
-
77
-
78
-
79
-
80
-
81
-
82
-
83
-
84
-
85
-
86
-
87
-
88
-
89
-
90
-
91
-
92
-
93
-
94
-
95
-
96
-
97
-
98
-
99
-
100
-
101
-
102
-
103
-
104
-
105
-
106
-
107
-
108
-
109
-
110
-
111
-
112
-
113
-
114
-
115
-
116
-
117
-
118
-
119
-
120
-
121
-
122
-
123
-
124
-
125
-
126
-
127
-
128
-
129
-
130
-
131
-
132
-
133
-
134
-
135
-
136
-
137
-
138
 |
 |