HP StorageWorks 8/80 Brocade Web Tools Administrator's Guide v6.2.0 (53-100119 - Page 144
Admin Domain considerations, Predefined performance graphs, Advanced Monitoring, Performance Graphs
 |
View all HP StorageWorks 8/80 manuals
Add to My Manuals
Save this manual to your list of manuals |
Page 144 highlights
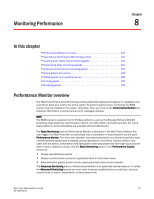
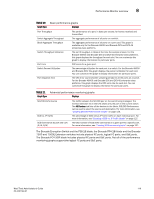
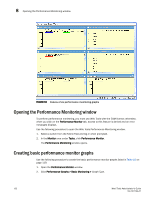
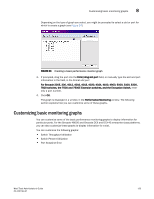
8 Performance Monitor overview The Advanced Monitoring option in the Performance Graphs window displays pre-defined reports and filter-based performance monitoring. You can use this feature to track the following: • The number of words received and transmitted in Fibre Channel frames with a defined SID/ DID pair. • The number of times a particular filter pattern in a frame is transmitted by a port. For detailed information on performance monitoring, see the Fabric OS Administrator's Guide. Each graph is displayed individually in a window, so it can be minimized, maximized, resized, and closed. Graphs within the Performance Monitoring window are updated every 30 seconds. When you first display the graph or if you modify the graph (such as to add additional ports), you might have to wait up to 30 seconds before the new values are shown. When you have multiple graphs open in the Performance Monitoring window, you can: • Click Window > Tile to view all graphs at once, tiled in the Performance Monitoring window. • Select Window > Cascade to view one graph at a time. • Select Window > Close All to close all open Performance Monitor graphs in the Performance Monitoring window. In addition, the Window menu lists all open graphs. You can click Window, and then select a graph name to view that graph. Admin Domain considerations • If you are not the switch owner, you will see the following ports: • E_Ports, including EX_Ports • directly owned ports • indirect ports • You can use the Advanced Performance Monitoring feature only in AD255 or in AD0 if there are no other user-defined Admin Domains. Otherwise, access to Advanced Monitoring features in the Performance Graphs menu will be unavailable. • It is recommended that you define a user with a switchadmin role and give that user access to AD255 for the purpose of data collecting using the Advanced Performance Monitor. Predefined performance graphs Web Tools predefines basic graph types to simplify performance monitoring. A wide range of endto-end fabric, LUN, device, and port metrics graphs are included. Table 10 lists the basic monitoring graphs available. Table 11 on page 119 lists the advanced monitoring graphs. The advanced monitoring graphs give more detailed performance information to help you manage your fabric. You can access the basic monitoring graphs on all switches; advanced monitoring graphs are available only on switches that have a Brocade Advanced Performance Monitoring license activated. 118 Web Tools Administrator's Guide 53-1001194-01
-
 1
1 -
2
-
3
-
4
-
5
-
6
-
7
-
8
-
9
-
10
-
11
-
12
-
13
-
14
-
15
-
16
-
17
-
18
-
19
-
20
-
21
-
22
-
23
-
24
-
25
-
26
-
27
-
28
-
29
-
30
-
31
-
32
-
33
-
34
-
35
-
36
-
37
-
38
-
39
-
40
-
41
-
42
-
43
-
44
-
45
-
46
-
47
-
48
-
49
-
50
-
51
-
52
-
53
-
54
-
55
-
56
-
57
-
58
-
59
-
60
-
61
-
62
-
63
-
64
-
65
-
66
-
67
-
68
-
69
-
70
-
71
-
72
-
73
-
74
-
75
-
76
-
77
-
78
-
79
-
80
-
81
-
82
-
83
-
84
-
85
-
86
-
87
-
88
-
89
-
90
-
91
-
92
-
93
-
94
-
95
-
96
-
97
-
98
-
99
-
100
-
101
-
102
-
103
-
104
-
105
-
106
-
107
-
108
-
109
-
110
-
111
-
112
-
113
-
114
-
115
-
116
-
117
-
118
-
119
-
120
-
121
-
122
-
123
-
124
-
125
-
126
-
127
-
128
-
129
-
130
-
131
-
132
-
133
-
134
-
135
-
136
-
137
-
138
-
 139
139 -
 140
140 -
 141
141 -
 142
142 -
 143
143 -
 144
144 -
 145
145 -
 146
146 -
 147
147 -
 148
148 -
 149
149 -
150
-
151
-
152
-
153
-
154
-
155
-
156
-
157
-
158
-
159
-
160
-
161
-
162
-
163
-
164
-
165
-
166
-
167
-
168
-
169
-
170
-
171
-
172
-
173
-
174
-
175
-
176
-
177
-
178
-
179
-
180
-
181
-
182
-
183
-
184
-
185
-
186
-
187
-
188
-
189
-
190
-
191
-
192
-
193
-
194
-
195
-
196
-
197
-
198
-
199
-
200
-
201
-
202
-
203
-
204
-
205
-
206
-
207
-
208
-
209
-
210
-
211
-
212
-
213
-
214
-
215
-
216
-
217
-
218
-
219
-
220
-
221
-
222
-
223
-
224
-
225
-
226
-
227
-
228
-
229
-
230
-
231
-
232
-
233
-
234
-
235
-
236
-
237
-
238
-
239
-
240
-
241
-
242
-
243
-
244
-
245
-
246
-
247
-
248
-
249
-
250
-
251
-
252
-
253
-
254
-
255
-
256
-
257
-
258
-
259
-
260
-
261
-
262
-
263
-
264
-
265
-
266
-
267
-
268
-
269
-
270
-
271
-
272
-
273
-
274
-
275
-
276
-
277
-
278
-
279
-
280
-
281
-
282
-
283
-
284
-
285
-
286
-
287
-
288
-
289
-
290
-
291
-
292
-
293
-
294
-
295
-
296
-
297
-
298
-
299
-
300
-
301
-
302
-
303
-
304
-
305
-
306
-
307
-
308
-
309
-
310
-
311
-
312
-
313
-
314
 |
 |