HP StorageWorks 8/80 Brocade Web Tools Administrator's Guide v6.2.0 (53-100119 - Page 153
Creating a SCSI vs. IP Traffic Graph, Creating SCSI command graphs
 |
View all HP StorageWorks 8/80 manuals
Add to My Manuals
Save this manual to your list of manuals |
Page 153 highlights
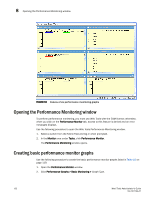
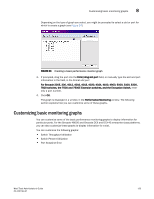
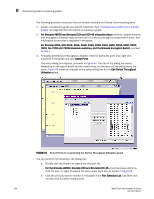
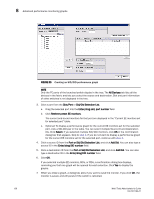
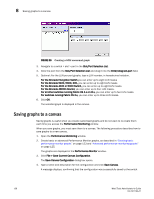
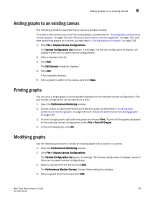
Advanced performance monitoring graphs 8 Creating a SCSI vs. IP Traffic Graph The SCSI vs. IP Traffic graph displays the SCSI versus IP traffic for selected ports. For Brocade 48000 and Brocade DCX and DCX-4S enterprise-class platforms, the slot and port name are identified in the graph. In a trunk group, the SCSI vs. IP Traffic graph displays only the master port and not the slave ports. 1. Open the Performance Monitoring window. 2. Click Performance Graphs > Advanced Monitoring > SCSI vs. IP Traffic. The SCSI vs. IP Traffic Setup dialog box opens. This dialog box is similar to that shown in Figure 64 on page 124. 3. Double-click the domain to expand the slot/port list. For Brocade 48000 and Brocade DCX and DCX-4S enterprise-class platforms, click the (plus) + signs to expand the ports under each slot, as shown in Figure 64. 4. Click the port you want to monitor in the graph in the Port Selection List. Use Shift-click and Ctrl-click to select multiple ports. 5. Click Add to move the selected ports to the Selected Ports list. 6. Optional: Click ADD ALL Ports to add all of the ports in the Port Selection List to the Selected Ports list. 7. Optional: Click Search to open the Search Port Selection List dialog box, from which you can search for all E_Ports, all F_Ports, or all port names with a defined string. Select the ports you want to add and click Search in the Search Port Selection List dialog box. 8. Click Apply in the SCSI vs. IP Traffic Setup dialog box. Only the selected ports are displayed in the SCSI vs. IP traffic graph. Creating SCSI command graphs This graph displays the total number of read or write (or both) commands on a given port or to a specific LUN on a given port. 1. Open the Performance Monitoring window. 2. Click Performance Graphs > Advanced Monitoring > SCSI Commands > Graph Type. The applicable setup dialog box opens. Figure 66 on page 128 shows the "SCSI Read/Write on a LUN per port Setup" dialog box. Web Tools Administrator's Guide 127 53-1001194-01
-
 1
1 -
2
-
3
-
4
-
5
-
6
-
7
-
8
-
9
-
10
-
11
-
12
-
13
-
14
-
15
-
16
-
17
-
18
-
19
-
20
-
21
-
22
-
23
-
24
-
25
-
26
-
27
-
28
-
29
-
30
-
31
-
32
-
33
-
34
-
35
-
36
-
37
-
38
-
39
-
40
-
41
-
42
-
43
-
44
-
45
-
46
-
47
-
48
-
49
-
50
-
51
-
52
-
53
-
54
-
55
-
56
-
57
-
58
-
59
-
60
-
61
-
62
-
63
-
64
-
65
-
66
-
67
-
68
-
69
-
70
-
71
-
72
-
73
-
74
-
75
-
76
-
77
-
78
-
79
-
80
-
81
-
82
-
83
-
84
-
85
-
86
-
87
-
88
-
89
-
90
-
91
-
92
-
93
-
94
-
95
-
96
-
97
-
98
-
99
-
100
-
101
-
102
-
103
-
104
-
105
-
106
-
107
-
108
-
109
-
110
-
111
-
112
-
113
-
114
-
115
-
116
-
117
-
118
-
119
-
120
-
121
-
122
-
123
-
124
-
125
-
126
-
127
-
128
-
129
-
130
-
131
-
132
-
133
-
134
-
135
-
136
-
137
-
138
-
139
-
140
-
141
-
142
-
143
-
144
-
145
-
146
-
147
-
 148
148 -
 149
149 -
 150
150 -
 151
151 -
 152
152 -
 153
153 -
 154
154 -
 155
155 -
 156
156 -
 157
157 -
 158
158 -
159
-
160
-
161
-
162
-
163
-
164
-
165
-
166
-
167
-
168
-
169
-
170
-
171
-
172
-
173
-
174
-
175
-
176
-
177
-
178
-
179
-
180
-
181
-
182
-
183
-
184
-
185
-
186
-
187
-
188
-
189
-
190
-
191
-
192
-
193
-
194
-
195
-
196
-
197
-
198
-
199
-
200
-
201
-
202
-
203
-
204
-
205
-
206
-
207
-
208
-
209
-
210
-
211
-
212
-
213
-
214
-
215
-
216
-
217
-
218
-
219
-
220
-
221
-
222
-
223
-
224
-
225
-
226
-
227
-
228
-
229
-
230
-
231
-
232
-
233
-
234
-
235
-
236
-
237
-
238
-
239
-
240
-
241
-
242
-
243
-
244
-
245
-
246
-
247
-
248
-
249
-
250
-
251
-
252
-
253
-
254
-
255
-
256
-
257
-
258
-
259
-
260
-
261
-
262
-
263
-
264
-
265
-
266
-
267
-
268
-
269
-
270
-
271
-
272
-
273
-
274
-
275
-
276
-
277
-
278
-
279
-
280
-
281
-
282
-
283
-
284
-
285
-
286
-
287
-
288
-
289
-
290
-
291
-
292
-
293
-
294
-
295
-
296
-
297
-
298
-
299
-
300
-
301
-
302
-
303
-
304
-
305
-
306
-
307
-
308
-
309
-
310
-
311
-
312
-
313
-
314
 |
 |