HP StorageWorks 8/80 Brocade Web Tools Administrator's Guide v6.2.0 (53-100119 - Page 145
TABLE 10, Performance Monitor overview
 |
View all HP StorageWorks 8/80 manuals
Add to My Manuals
Save this manual to your list of manuals |
Page 145 highlights
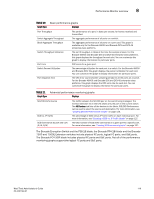
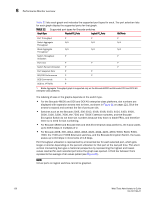
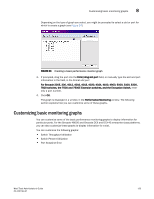
Performance Monitor overview 8 TABLE 10 Basic performance graphs Graph Type Displays Port Throughput Switch Aggregate Throughput Blade Aggregate Throughput Switch Throughput Utilization Port Error Switch Percent Utilization Port Snapshot Error The performance of a port, in bytes per second, for frames received and transmitted. The aggregate performance of all ports on a switch. The aggregate performance of all ports on a port card. This graph is available only for the Brocade 48000 and Brocade DCX and DCX-4S enterprise-class platforms. The port throughput, in Gbps at the time the sample is taken. For the Brocade 48000 and Brocade DCX and DCX-4S enterprise-class platforms, this graph displays the throughput for each slot. You can customize this graph to display information for particular ports. CRC errors for a given port. The percentage utilization for each port in a switch. For the Brocade 48000 and Brocade DCX, this graph displays the percent utilization for each slot. You can customize this graph to display information for particular ports. The CRC error count between sampling periods for all the ports on a switch. For the Brocade 48000 and Brocade DCX and DCX-4S enterprise-class platforms, this graph displays the CRC error rate for each slot. You can customize this graph to display information for particular ports. TABLE 11 Advanced performance monitoring graphs Graph Type Displays SID/DID Performance SCSI vs. IP Traffic SCSI Commands by port and LUN (R, W, R/W) The traffic between the SID-DID pair on the switch being managed. The member selection list in the LHS shows only the port in the current switch. The All Devices tab lists all the devices in the fabric. SID/DID Performance can be used to select the source and destination. For more information, see "Creating SID-DID Performance Graphs" on page 125. The percentage of SCSI versus IP frame traffic on each individual port. For more information, see "Creating a SCSI vs. IP Traffic Graph" on page 127. The total number of read/write commands on a given port to a specific LUN. For more information, see "Creating SCSI command graphs" on page 127. The Brocade Encryption Switch and the FS8-18 blade, the Brocade FR4-18i blade and the Brocade 7500 and 7500E Extension switches include physical FC ports, logical FC ports, and GbE ports. The Brocade FC4-16IP blade includes physical FC ports and GbE ports. Not all of the performance monitoring graphs support the logical FC ports and GbE ports. Web Tools Administrator's Guide 119 53-1001194-01
-
 1
1 -
2
-
3
-
4
-
5
-
6
-
7
-
8
-
9
-
10
-
11
-
12
-
13
-
14
-
15
-
16
-
17
-
18
-
19
-
20
-
21
-
22
-
23
-
24
-
25
-
26
-
27
-
28
-
29
-
30
-
31
-
32
-
33
-
34
-
35
-
36
-
37
-
38
-
39
-
40
-
41
-
42
-
43
-
44
-
45
-
46
-
47
-
48
-
49
-
50
-
51
-
52
-
53
-
54
-
55
-
56
-
57
-
58
-
59
-
60
-
61
-
62
-
63
-
64
-
65
-
66
-
67
-
68
-
69
-
70
-
71
-
72
-
73
-
74
-
75
-
76
-
77
-
78
-
79
-
80
-
81
-
82
-
83
-
84
-
85
-
86
-
87
-
88
-
89
-
90
-
91
-
92
-
93
-
94
-
95
-
96
-
97
-
98
-
99
-
100
-
101
-
102
-
103
-
104
-
105
-
106
-
107
-
108
-
109
-
110
-
111
-
112
-
113
-
114
-
115
-
116
-
117
-
118
-
119
-
120
-
121
-
122
-
123
-
124
-
125
-
126
-
127
-
128
-
129
-
130
-
131
-
132
-
133
-
134
-
135
-
136
-
137
-
138
-
139
-
 140
140 -
 141
141 -
 142
142 -
 143
143 -
 144
144 -
 145
145 -
 146
146 -
 147
147 -
 148
148 -
 149
149 -
 150
150 -
151
-
152
-
153
-
154
-
155
-
156
-
157
-
158
-
159
-
160
-
161
-
162
-
163
-
164
-
165
-
166
-
167
-
168
-
169
-
170
-
171
-
172
-
173
-
174
-
175
-
176
-
177
-
178
-
179
-
180
-
181
-
182
-
183
-
184
-
185
-
186
-
187
-
188
-
189
-
190
-
191
-
192
-
193
-
194
-
195
-
196
-
197
-
198
-
199
-
200
-
201
-
202
-
203
-
204
-
205
-
206
-
207
-
208
-
209
-
210
-
211
-
212
-
213
-
214
-
215
-
216
-
217
-
218
-
219
-
220
-
221
-
222
-
223
-
224
-
225
-
226
-
227
-
228
-
229
-
230
-
231
-
232
-
233
-
234
-
235
-
236
-
237
-
238
-
239
-
240
-
241
-
242
-
243
-
244
-
245
-
246
-
247
-
248
-
249
-
250
-
251
-
252
-
253
-
254
-
255
-
256
-
257
-
258
-
259
-
260
-
261
-
262
-
263
-
264
-
265
-
266
-
267
-
268
-
269
-
270
-
271
-
272
-
273
-
274
-
275
-
276
-
277
-
278
-
279
-
280
-
281
-
282
-
283
-
284
-
285
-
286
-
287
-
288
-
289
-
290
-
291
-
292
-
293
-
294
-
295
-
296
-
297
-
298
-
299
-
300
-
301
-
302
-
303
-
304
-
305
-
306
-
307
-
308
-
309
-
310
-
311
-
312
-
313
-
314
 |
 |
