HP StorageWorks 8/80 Brocade Web Tools Administrator's Guide v6.2.0 (53-100119 - Page 155
Adding graphs to an existing canvas, Printing graphs, Modifying graphs
 |
View all HP StorageWorks 8/80 manuals
Add to My Manuals
Save this manual to your list of manuals |
Page 155 highlights
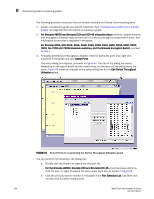
Adding graphs to an existing canvas 8 Adding graphs to an existing canvas The following procedure assumes that a canvas is already created. To create a new canvas, you must first create graphs, as described in "Creating basic performance monitor graphs" on page 123 and "Advanced performance monitoring graphs" on page 125, and then save those graphs to a canvas, as described in "Saving graphs to a canvas" on page 128. 1. Click File > Display Canvas Configurations. The Canvas Configuration List displays. A message "No Canvas configuration to display" will display if there are no saved canvas configurations. 2. Click a canvas in the list. 3. Click Edit. The Edit Canvas dialog box displays. 4. Click Add. A list of graphs displays. 5. Click a graph to add it to the canvas, and click Save. Printing graphs You can print a single graph or all the graphs displayed on the selected canvas configuration. Only one canvas configuration can be opened at a time. 1. Open the Performance Monitoring window. 2. Create a basic or advanced Performance Monitor graph as described in "Creating basic performance monitor graphs" on page 123 and "Advanced performance monitoring graphs" on page 125. 3. To print a single graph, right-click the graph and choose Print. To print all the graphs displayed on the selected canvas configuration, select File > Print All Graphs. 4. In the print dialog box, click OK. Modifying graphs Use the following procedure to modify an existing graph that is saved in a canvas. 1. Open the Performance Monitoring window. 2. Click File > Display Canvas Configurations. The Canvas Configuration List opens. A message "No Canvas configuration to display" opens if there are no saved canvas configurations. 3. Select a canvas from the list and click Edit. The Performance Monitor Canvas: Canvas Name dialog box displays. 4. Select a graph from the list and click Edit. Web Tools Administrator's Guide 129 53-1001194-01
-
 1
1 -
2
-
3
-
4
-
5
-
6
-
7
-
8
-
9
-
10
-
11
-
12
-
13
-
14
-
15
-
16
-
17
-
18
-
19
-
20
-
21
-
22
-
23
-
24
-
25
-
26
-
27
-
28
-
29
-
30
-
31
-
32
-
33
-
34
-
35
-
36
-
37
-
38
-
39
-
40
-
41
-
42
-
43
-
44
-
45
-
46
-
47
-
48
-
49
-
50
-
51
-
52
-
53
-
54
-
55
-
56
-
57
-
58
-
59
-
60
-
61
-
62
-
63
-
64
-
65
-
66
-
67
-
68
-
69
-
70
-
71
-
72
-
73
-
74
-
75
-
76
-
77
-
78
-
79
-
80
-
81
-
82
-
83
-
84
-
85
-
86
-
87
-
88
-
89
-
90
-
91
-
92
-
93
-
94
-
95
-
96
-
97
-
98
-
99
-
100
-
101
-
102
-
103
-
104
-
105
-
106
-
107
-
108
-
109
-
110
-
111
-
112
-
113
-
114
-
115
-
116
-
117
-
118
-
119
-
120
-
121
-
122
-
123
-
124
-
125
-
126
-
127
-
128
-
129
-
130
-
131
-
132
-
133
-
134
-
135
-
136
-
137
-
138
-
139
-
140
-
141
-
142
-
143
-
144
-
145
-
146
-
147
-
148
-
149
-
 150
150 -
 151
151 -
 152
152 -
 153
153 -
 154
154 -
 155
155 -
 156
156 -
 157
157 -
 158
158 -
 159
159 -
 160
160 -
161
-
162
-
163
-
164
-
165
-
166
-
167
-
168
-
169
-
170
-
171
-
172
-
173
-
174
-
175
-
176
-
177
-
178
-
179
-
180
-
181
-
182
-
183
-
184
-
185
-
186
-
187
-
188
-
189
-
190
-
191
-
192
-
193
-
194
-
195
-
196
-
197
-
198
-
199
-
200
-
201
-
202
-
203
-
204
-
205
-
206
-
207
-
208
-
209
-
210
-
211
-
212
-
213
-
214
-
215
-
216
-
217
-
218
-
219
-
220
-
221
-
222
-
223
-
224
-
225
-
226
-
227
-
228
-
229
-
230
-
231
-
232
-
233
-
234
-
235
-
236
-
237
-
238
-
239
-
240
-
241
-
242
-
243
-
244
-
245
-
246
-
247
-
248
-
249
-
250
-
251
-
252
-
253
-
254
-
255
-
256
-
257
-
258
-
259
-
260
-
261
-
262
-
263
-
264
-
265
-
266
-
267
-
268
-
269
-
270
-
271
-
272
-
273
-
274
-
275
-
276
-
277
-
278
-
279
-
280
-
281
-
282
-
283
-
284
-
285
-
286
-
287
-
288
-
289
-
290
-
291
-
292
-
293
-
294
-
295
-
296
-
297
-
298
-
299
-
300
-
301
-
302
-
303
-
304
-
305
-
306
-
307
-
308
-
309
-
310
-
311
-
312
-
313
-
314
 |
 |