HP StorageWorks 8/80 Brocade Web Tools Administrator's Guide v6.2.0 (53-100119 - Page 150
For the Brocade 48000, Brocade DCX and Brocade DCX 4S
 |
View all HP StorageWorks 8/80 manuals
Add to My Manuals
Save this manual to your list of manuals |
Page 150 highlights
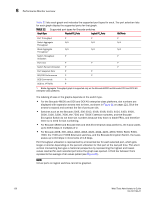
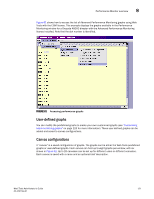
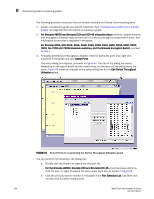
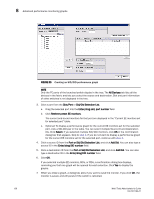
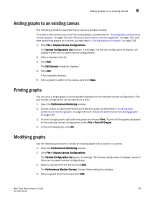
8 Customizing basic monitoring graphs The following procedure assumes that you already created one of these customizable graphs. 1. Create or access the graph you want to customize. See "Creating basic performance monitor graphs" on page 123 for instructions on creating a graph. 2. For Brocade 48000 and Brocade DCX and DCX-4S enterprise-class platforms, display detailed port throughput utilization rates for each port in a slot by clicking the arrows next to a slot. Port information for that slot is displayed in the graph. For Brocade 200E, 300 4012, 4016, 4018, 4020, 4024, 4100, 4900, 5000, 5100, 5300, 7600, the 7500 and 7500E Extension switches, and the Brocade Encryption Switch, proceed to step 3. 3. To display detailed port throughput utilization rates for particular ports only, right-click anywhere in the graph and click Select Ports. The setup dialog box displays, as shown in Figure 64. The title of the dialog box varies, depending on the type of graph you are customizing, but the layout of the dialog box is the same. Figure 64 shows an example of the setup dialog box for the Edit Switch Throughput Utilization graph. FIGURE 64 Select Ports for customizing the Switch Throughput Utilization graph You can perform the following in the dialog box: a. Double-click the domain to expand the slot/port list. For the Brocade 48000, Brocade DCX and Brocade DCX 4S enterprise-class platforms, click the plus (+) signs to expand the ports under each slot, as shown in Figure 64. b. Click the port you want to monitor in the graph in the Port Selection List. Use Shift-click and Ctrl-click to select multiple ports. 124 Web Tools Administrator's Guide 53-1001194-01
-
 1
1 -
2
-
3
-
4
-
5
-
6
-
7
-
8
-
9
-
10
-
11
-
12
-
13
-
14
-
15
-
16
-
17
-
18
-
19
-
20
-
21
-
22
-
23
-
24
-
25
-
26
-
27
-
28
-
29
-
30
-
31
-
32
-
33
-
34
-
35
-
36
-
37
-
38
-
39
-
40
-
41
-
42
-
43
-
44
-
45
-
46
-
47
-
48
-
49
-
50
-
51
-
52
-
53
-
54
-
55
-
56
-
57
-
58
-
59
-
60
-
61
-
62
-
63
-
64
-
65
-
66
-
67
-
68
-
69
-
70
-
71
-
72
-
73
-
74
-
75
-
76
-
77
-
78
-
79
-
80
-
81
-
82
-
83
-
84
-
85
-
86
-
87
-
88
-
89
-
90
-
91
-
92
-
93
-
94
-
95
-
96
-
97
-
98
-
99
-
100
-
101
-
102
-
103
-
104
-
105
-
106
-
107
-
108
-
109
-
110
-
111
-
112
-
113
-
114
-
115
-
116
-
117
-
118
-
119
-
120
-
121
-
122
-
123
-
124
-
125
-
126
-
127
-
128
-
129
-
130
-
131
-
132
-
133
-
134
-
135
-
136
-
137
-
138
-
139
-
140
-
141
-
142
-
143
-
144
-
 145
145 -
 146
146 -
 147
147 -
 148
148 -
 149
149 -
 150
150 -
 151
151 -
 152
152 -
 153
153 -
 154
154 -
 155
155 -
156
-
157
-
158
-
159
-
160
-
161
-
162
-
163
-
164
-
165
-
166
-
167
-
168
-
169
-
170
-
171
-
172
-
173
-
174
-
175
-
176
-
177
-
178
-
179
-
180
-
181
-
182
-
183
-
184
-
185
-
186
-
187
-
188
-
189
-
190
-
191
-
192
-
193
-
194
-
195
-
196
-
197
-
198
-
199
-
200
-
201
-
202
-
203
-
204
-
205
-
206
-
207
-
208
-
209
-
210
-
211
-
212
-
213
-
214
-
215
-
216
-
217
-
218
-
219
-
220
-
221
-
222
-
223
-
224
-
225
-
226
-
227
-
228
-
229
-
230
-
231
-
232
-
233
-
234
-
235
-
236
-
237
-
238
-
239
-
240
-
241
-
242
-
243
-
244
-
245
-
246
-
247
-
248
-
249
-
250
-
251
-
252
-
253
-
254
-
255
-
256
-
257
-
258
-
259
-
260
-
261
-
262
-
263
-
264
-
265
-
266
-
267
-
268
-
269
-
270
-
271
-
272
-
273
-
274
-
275
-
276
-
277
-
278
-
279
-
280
-
281
-
282
-
283
-
284
-
285
-
286
-
287
-
288
-
289
-
290
-
291
-
292
-
293
-
294
-
295
-
296
-
297
-
298
-
299
-
300
-
301
-
302
-
303
-
304
-
305
-
306
-
307
-
308
-
309
-
310
-
311
-
312
-
313
-
314
 |
 |