HP StorageWorks 8/80 Brocade Web Tools Administrator's Guide v6.2.0 (53-100119 - Page 152
IDs. Click, Port or Sid/Did Selection List
 |
View all HP StorageWorks 8/80 manuals
Add to My Manuals
Save this manual to your list of manuals |
Page 152 highlights
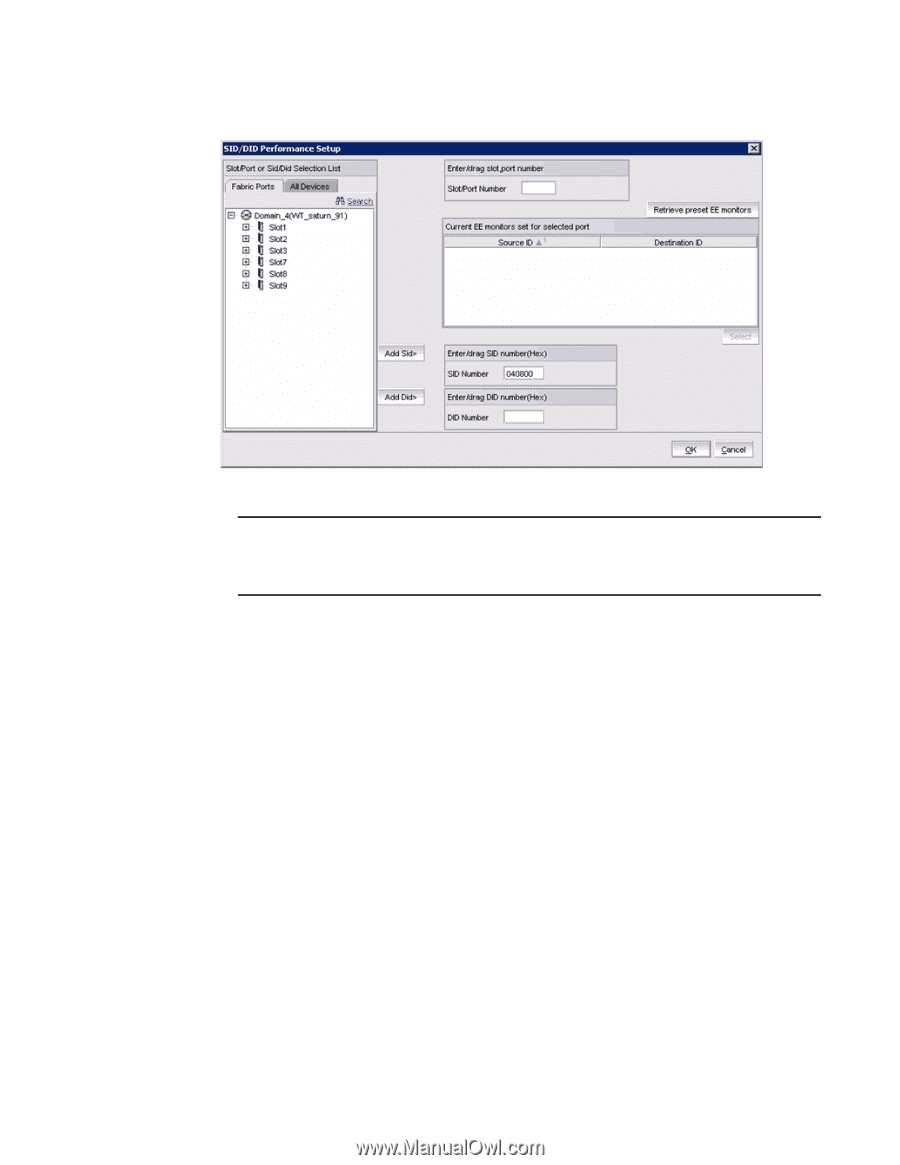
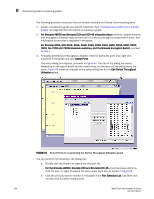
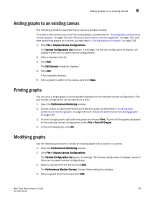
8 Advanced performance monitoring graphs FIGURE 65 Creating an SID/DID performance graph NOTE Only the FC ports of the launched switch display in the tree. The All Devices tab lists all the devices in the fabric and lets you select the source and destination. Slot and port information of other switches is not displayed in the tree. 3. Click a port from the Slot/Port or Sid/Did Selection List. a. Drag the selected port into the Enter/drag slot, port number field. b. Click Retrieve preset EE monitors. The current end-to-end monitors for that port are displayed in the "Current EE monitors set for selected port" table. c. Optional: To display a performance graph for the current EE monitors set for the selected port, click a SID-DID pair in the table. You can select multiple Source ID and Destination IDs. Click Select. If you selected multiple SID/DID monitors, click OK in the confirmation dialog box that appears. Skip to step 6. If you do not want to display a performance graph for the current EE monitors set for the selected port, continue with step 4. 4. Click a source ID from the Port or Sid/Did Selection List, and click Add Sid. You can also type a source ID in the Enter/drag SID number field. 5. Click a destination ID from the Port or Sid/Did Selection List, and click Add Did. You can also type a destination ID in the Enter/drag DID number field. 6. Click OK. If you selected multiple EE monitors, SIDs, or PIDs, a confirmation dialog box displays, reminding you that one graph will be opened for each selection. Click Yes to display the graphs. 7. When you close a graph, a dialog box asks if you want to save the monitor. If you click OK, the monitor is saved, and will persist if the switch is rebooted. 126 Web Tools Administrator's Guide 53-1001194-01
-
 1
1 -
2
-
3
-
4
-
5
-
6
-
7
-
8
-
9
-
10
-
11
-
12
-
13
-
14
-
15
-
16
-
17
-
18
-
19
-
20
-
21
-
22
-
23
-
24
-
25
-
26
-
27
-
28
-
29
-
30
-
31
-
32
-
33
-
34
-
35
-
36
-
37
-
38
-
39
-
40
-
41
-
42
-
43
-
44
-
45
-
46
-
47
-
48
-
49
-
50
-
51
-
52
-
53
-
54
-
55
-
56
-
57
-
58
-
59
-
60
-
61
-
62
-
63
-
64
-
65
-
66
-
67
-
68
-
69
-
70
-
71
-
72
-
73
-
74
-
75
-
76
-
77
-
78
-
79
-
80
-
81
-
82
-
83
-
84
-
85
-
86
-
87
-
88
-
89
-
90
-
91
-
92
-
93
-
94
-
95
-
96
-
97
-
98
-
99
-
100
-
101
-
102
-
103
-
104
-
105
-
106
-
107
-
108
-
109
-
110
-
111
-
112
-
113
-
114
-
115
-
116
-
117
-
118
-
119
-
120
-
121
-
122
-
123
-
124
-
125
-
126
-
127
-
128
-
129
-
130
-
131
-
132
-
133
-
134
-
135
-
136
-
137
-
138
-
139
-
140
-
141
-
142
-
143
-
144
-
145
-
146
-
 147
147 -
 148
148 -
 149
149 -
 150
150 -
 151
151 -
 152
152 -
 153
153 -
 154
154 -
 155
155 -
 156
156 -
 157
157 -
158
-
159
-
160
-
161
-
162
-
163
-
164
-
165
-
166
-
167
-
168
-
169
-
170
-
171
-
172
-
173
-
174
-
175
-
176
-
177
-
178
-
179
-
180
-
181
-
182
-
183
-
184
-
185
-
186
-
187
-
188
-
189
-
190
-
191
-
192
-
193
-
194
-
195
-
196
-
197
-
198
-
199
-
200
-
201
-
202
-
203
-
204
-
205
-
206
-
207
-
208
-
209
-
210
-
211
-
212
-
213
-
214
-
215
-
216
-
217
-
218
-
219
-
220
-
221
-
222
-
223
-
224
-
225
-
226
-
227
-
228
-
229
-
230
-
231
-
232
-
233
-
234
-
235
-
236
-
237
-
238
-
239
-
240
-
241
-
242
-
243
-
244
-
245
-
246
-
247
-
248
-
249
-
250
-
251
-
252
-
253
-
254
-
255
-
256
-
257
-
258
-
259
-
260
-
261
-
262
-
263
-
264
-
265
-
266
-
267
-
268
-
269
-
270
-
271
-
272
-
273
-
274
-
275
-
276
-
277
-
278
-
279
-
280
-
281
-
282
-
283
-
284
-
285
-
286
-
287
-
288
-
289
-
290
-
291
-
292
-
293
-
294
-
295
-
296
-
297
-
298
-
299
-
300
-
301
-
302
-
303
-
304
-
305
-
306
-
307
-
308
-
309
-
310
-
311
-
312
-
313
-
314
 |
 |