| Section |
Page |
| Contents |
7 |
| Figures |
19 |
| Tables |
23 |
| About This Document |
25 |
| In this chapter |
25 |
| How this document is organized |
25 |
| Supported hardware and software |
26 |
| What’s new in this document |
27 |
| Document conventions |
27 |
| Text formatting |
27 |
| Notes, cautions, and warnings |
28 |
| Key terms |
28 |
| Notice to the reader |
28 |
| Additional information |
29 |
| Brocade resources |
29 |
| Other industry resources |
29 |
| Getting technical help |
29 |
| Document feedback |
30 |
| Introducing Web Tools |
31 |
| In this chapter |
31 |
| Web Tools overview |
31 |
| What’s new in this release |
31 |
| Web Tools, the EGM license, and DCFM |
32 |
| Web Tools features enabled by the EGM license |
32 |
| Web Tools functionality moved to DCFM |
34 |
| System requirements |
35 |
| Setting Refresh Frequency for Internet Explorer |
36 |
| Deleting temporary internet files used by Java applications |
36 |
| Java installation on the workstation |
37 |
| Installing the JRE on your Solaris or Linux client workstation |
37 |
| Installing patches on Solaris |
38 |
| Installing the Java plug-in on Windows |
38 |
| Java plug-in configuration |
38 |
| Configuring the Java plug-in for Windows |
38 |
| Configuring the Java plug-in for Mozilla family browsers |
39 |
| Value line licenses |
40 |
| Opening Web Tools |
41 |
| Logging in |
42 |
| Logging out |
46 |
| Role-Based Access Control |
46 |
| Session management |
47 |
| Ending a Web Tools session |
47 |
| Requirements for IPv6 support |
48 |
| Using the Web Tools Interface |
49 |
| In this chapter |
49 |
| Viewing Switch Explorer |
49 |
| Changes for consistency with DCFM |
52 |
| Tasks |
54 |
| Fabric Tree |
55 |
| Changing the Admin Domain context |
55 |
| Switch View buttons |
58 |
| Switch View |
58 |
| Switch Events and Switch Information |
61 |
| Free Professional Management Tool |
61 |
| Displaying tool tips |
62 |
| Right-click options |
62 |
| Refresh rates |
63 |
| Displaying switches in the fabric |
63 |
| Working with Web Tools: recommendations |
64 |
| Opening a Telnet or SSH client window |
65 |
| Collecting logs for troubleshooting |
65 |
| Managing Fabrics and Switches |
67 |
| In this chapter |
67 |
| Fabric and switch management overview |
67 |
| Opening the Switch Administration window |
69 |
| Refreshing the Switch Administration window |
69 |
| Configuring IP and netmask information |
70 |
| Configuring a syslog IP address |
71 |
| Removing a syslog IP address |
71 |
| Setting up IP Filtering |
71 |
| Blade management |
72 |
| Enabling or disabling a blade |
72 |
| Setting a slot-level IP address |
73 |
| Viewing IP addresses |
73 |
| Switch configuration |
74 |
| Enabling and disabling a switch |
74 |
| Changing the switch name |
74 |
| Changing the switch domain ID |
74 |
| Viewing and printing a switch report |
75 |
| Switch rebooting |
75 |
| Performing a fast boot |
75 |
| Performing a reboot |
75 |
| System configuration parameters |
76 |
| Configuring fabric settings |
76 |
| Enabling insistent domain ID mode |
77 |
| Configuring virtual channel settings |
77 |
| Configuring arbitrated loop parameters |
78 |
| Configuring system services |
79 |
| Configuring signed firmware |
79 |
| Licensed feature management |
79 |
| Activating a license on a switch |
80 |
| Removing a license from a switch |
81 |
| High Availability overview |
81 |
| Admin Domain considerations |
81 |
| Launching the High Availability Window |
81 |
| Synchronizing Services on the CP |
83 |
| Initiating a CP Failover |
83 |
| Event monitoring |
84 |
| Displaying Switch Events |
84 |
| Filtering Switch Events |
85 |
| Filtering events by event severity levels |
86 |
| Filtering events by message ID |
87 |
| Filtering events by service component |
87 |
| Displaying the Name Server entries |
87 |
| Printing the Name Server entries |
88 |
| Displaying Name Server information for a particular device |
88 |
| Displaying zone members for a particular device |
89 |
| Physically locating a switch using beaconing |
89 |
| Locating logical switches using chassis beaconing |
89 |
| Virtual Fabrics overview |
90 |
| Selecting a logical switch from the Switch View |
91 |
| Viewing Logical ports |
93 |
| Maintaining Configurations and Firmware |
95 |
| In this chapter |
95 |
| Creating a configuration backup file |
95 |
| Restoring a configuration |
97 |
| Admin Domain configuration maintenance |
99 |
| Uploading and downloading from USB storage |
100 |
| Performing a firmware download |
101 |
| Encryption firmware download |
103 |
| SAS and SA firmware download |
103 |
| Switch configurations for mixed fabrics |
104 |
| Enabling interoperability |
105 |
| Managing Your Ports |
107 |
| In this chapter |
107 |
| Port management overview |
107 |
| Opening the Port Administration window |
107 |
| Port Administration window components |
109 |
| Controllable ports |
111 |
| Configuring FC ports |
112 |
| Allowed Port Types |
114 |
| Long distance mode |
114 |
| FC Fastwrite |
115 |
| Assigning a name to a port |
115 |
| Enabling and disabling a port |
115 |
| Considerations for port enable and disable |
116 |
| Persistent enabling and disabling ports |
116 |
| Enabling and disabling NPIV ports |
117 |
| Port activation |
117 |
| Enabling Ports on Demand |
118 |
| Enabling Dynamic Ports on Demand |
118 |
| Disabling Dynamic Ports on Demand |
119 |
| Reserving and releasing licenses on a port basis |
119 |
| Port swapping index |
120 |
| Port swapping |
120 |
| Determining if a port index was swapped with another switch port |
120 |
| Managing Administrative Domains |
123 |
| In this chapter |
123 |
| Administrative domain overview |
123 |
| Requirements for Admin Domains |
123 |
| User-defined Admin Domains |
124 |
| System-defined Admin Domains |
124 |
| Admin Domain membership |
125 |
| Enabling administrative domains |
125 |
| Admin Domain window |
126 |
| Opening the Admin Domain window |
129 |
| Refreshing fabric information |
129 |
| Refreshing Admin Domain information |
130 |
| Saving local Admin Domain changes |
130 |
| Closing the Admin Domain window |
130 |
| Creating and populating domains |
131 |
| Creating an Admin Domain |
131 |
| Adding ports or switches to the fabric |
133 |
| Activating or deactivating an Admin Domain |
134 |
| Modifying Admin Domain members |
134 |
| Renaming Admin Domains |
136 |
| Deleting Admin Domains |
136 |
| Clearing the Admin Domain configuration |
136 |
| Enabling ISL Trunking |
137 |
| In this chapter |
137 |
| ISL trunking overview |
137 |
| Disabling or enabling ISL trunking |
138 |
| Admin Domain considerations |
138 |
| Viewing trunk group information |
139 |
| F_Port trunk groups |
140 |
| Creating and maintaining F_Port trunk groups |
140 |
| Monitoring Performance |
143 |
| In this chapter |
143 |
| Performance Monitor overview |
143 |
| Admin Domain considerations |
144 |
| Predefined performance graphs |
144 |
| User-defined graphs |
147 |
| Canvas configurations |
147 |
| Opening the Performance Monitoring window |
148 |
| Creating basic performance monitor graphs |
148 |
| Customizing basic monitoring graphs |
149 |
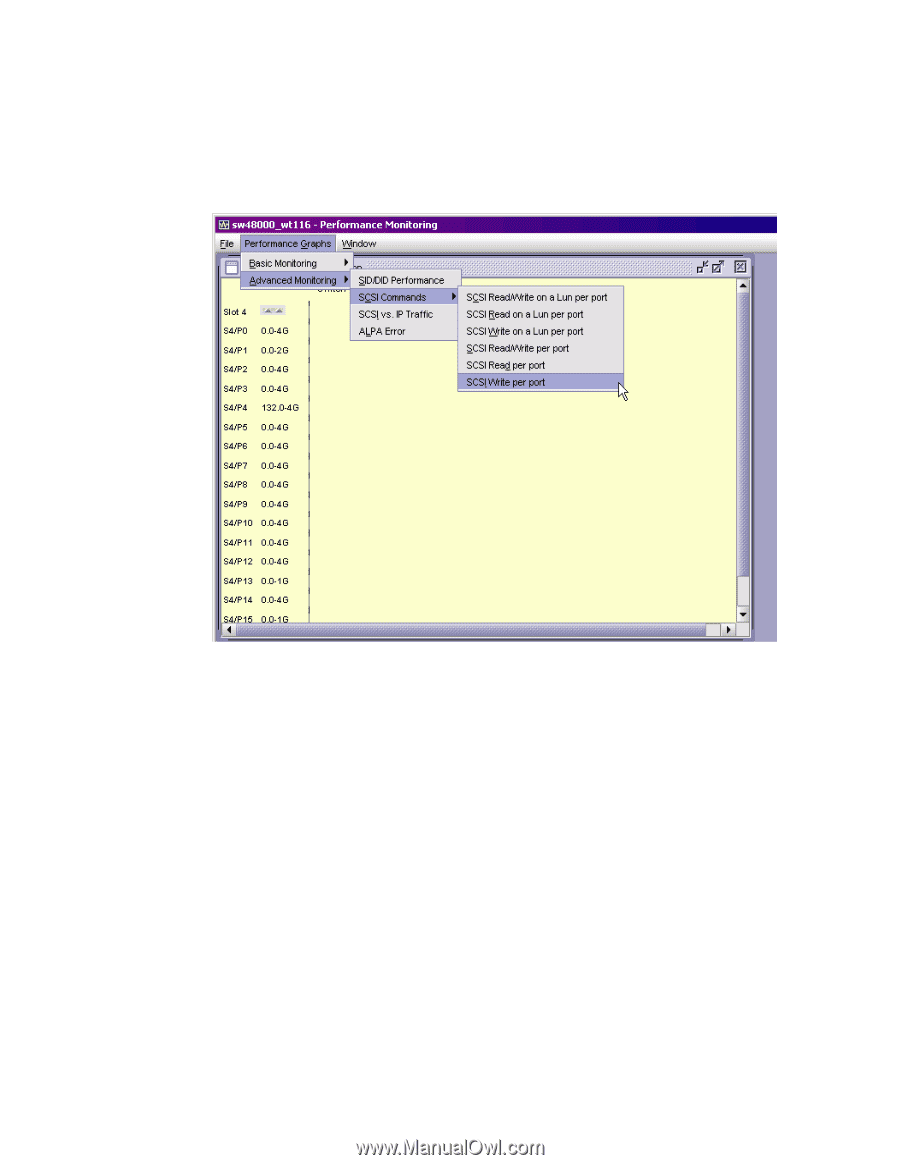
| Advanced performance monitoring graphs |
151 |
| Creating SID-DID Performance Graphs |
151 |
| Creating a SCSI vs. IP Traffic Graph |
153 |
| Creating SCSI command graphs |
153 |
| Saving graphs to a canvas |
154 |
| Adding graphs to an existing canvas |
155 |
| Printing graphs |
155 |
| Modifying graphs |
155 |
| Administering Zoning |
157 |
| In this chapter |
157 |
| Zoning overview |
157 |
| Basic Zones |
158 |
| Traffic Isolation zones |
158 |
| LSAN zone requirements |
158 |
| QoS zone requirements |
159 |
| Zoning configurations |
159 |
| Opening the Zone Administration window |
159 |
| Setting the default zoning mode |
159 |
| Zoning management |
160 |
| Refreshing fabric information |
162 |
| Refreshing Zone Administration window information |
162 |
| Saving local zoning changes |
163 |
| Select a zoning view |
163 |
| Creating and populating zone aliases |
164 |
| Adding and removing members of a zone alias |
164 |
| Renaming zone aliases |
165 |
| Deleting zone aliases |
165 |
| Creating and populating zones |
166 |
| Adding and removing members of a zone |
166 |
| Renaming zones |
167 |
| Cloning zones |
167 |
| Deleting zones |
168 |
| Creating and populating traffic isolation zones |
168 |
| Zone configuration and zoning database management |
169 |
| Creating zone configurations |
169 |
| Adding or removing zone configuration members |
170 |
| Renaming zone configurations |
170 |
| Cloning zone configurations |
171 |
| Deleting zone configurations |
171 |
| Enabling zone configurations |
171 |
| Disabling zone configurations |
172 |
| Displaying enabled zone configurations |
172 |
| Viewing the enabled zone configuration name without opening the Zone Administration window |
173 |
| Viewing detailed information about the enabled zone configuration |
173 |
| Adding a WWN to multiple aliases and zones |
174 |
| Removing a WWN from multiple aliases and zones |
174 |
| Replacing a WWN in Multiple Aliases and Zones |
174 |
| Searching for zone members |
175 |
| Clearing the Zoning Database |
175 |
| Zone configuration analysis |
176 |
| Best practices for zoning |
176 |
| Working With Diagnostic Features |
177 |
| In this chapter |
177 |
| Trace dumps |
177 |
| How a trace dump is used |
178 |
| Setting up automatic trace dump transfers |
178 |
| Specifying a remote server |
179 |
| Enabling automatic transfer of trace dumps |
179 |
| Disabling automatic trace uploads |
179 |
| Displaying switch information |
180 |
| Viewing detailed fan hardware status |
180 |
| Viewing the temperature status |
181 |
| Viewing the power supply status |
181 |
| Checking the physical health of a switch |
182 |
| Port LED interpretation |
184 |
| Port icon colors |
185 |
| LED representations |
185 |
| Brocade 48000 Director LEDs |
185 |
| Using the FC-FC Routing Service |
187 |
| In this chapter |
187 |
| Fibre Channel routing overview |
187 |
| Supported switches for Fibre Channel routing |
188 |
| Setting up FC-FC routing |
188 |
| FC-FC routing management |
189 |
| Opening the FC Routing module |
189 |
| Viewing and managing LSAN fabrics |
190 |
| Viewing EX_Ports |
191 |
| Configuring an EX_Port |
192 |
| Editing the configuration of an EX_Port |
193 |
| Configuring FCR router port cost |
193 |
| Viewing LSAN zones |
193 |
| Viewing LSAN Devices |
194 |
| Configuring the backbone fabric ID |
195 |
| Using the Access Gateway |
197 |
| In this chapter |
197 |
| Access Gateway overview |
197 |
| Enabling Access Gateway mode |
197 |
| Disabling Access Gateway mode |
198 |
| Viewing the Access Gateway settings |
198 |
| Port configuration |
199 |
| Creating port groups |
199 |
| Defining custom primary and secondary mapping |
200 |
| Access Gateway policy modification |
201 |
| Path Failover and Failback policies |
202 |
| Modifying Path Failover and Failback policies |
202 |
| Enabling the Automatic Port Configuration policy |
202 |
| Administering Fabric Watch |
205 |
| In this chapter |
205 |
| Fabric Watch overview |
205 |
| Using Fabric Watch with Web Tools |
206 |
| Opening the Fabric Watch window |
207 |
| Fabric Watch threshold configuration |
207 |
| Configuring threshold traits |
207 |
| Configuring threshold alarms |
209 |
| Enabling or disabling threshold alarms for individual elements |
209 |
| Configuring alarms for FRUs |
210 |
| Fabric Watch alarm information |
211 |
| Viewing an alarm configuration report |
211 |
| Displaying alarms |
211 |
| E-mail notification |
212 |
| Configuring the e-mail server on a switch |
212 |
| Configuring the e-mail alert |
212 |
| Administering Extended Fabrics |
215 |
| In this chapter |
215 |
| Extended link buffer allocation overview |
215 |
| Configuring a port for long distance |
217 |
| Administering the iSCSI Target Gateway |
219 |
| In this chapter |
219 |
| iSCSI service overview |
219 |
| Supported platforms for iSCSI |
220 |
| Common iSCSI Target Gateway Admin functions |
220 |
| Terminology |
221 |
| Saving Changes |
222 |
| Setting up iSCSI Target Gateway Services |
222 |
| Launching the iSCSI Target Gateway Admin Module |
222 |
| Launching the iSCSI Setup wizard |
224 |
| Activating the iSCSI feature |
224 |
| Encryption Services for the iSCSI Gateway |
224 |
| Configuring the IP interface |
225 |
| Editing an IP Address |
226 |
| Configuring the IP route (optional) |
227 |
| Editing the IP route |
227 |
| Creating iSCSI virtual targets |
228 |
| Using Easy Create to create iSCSI virtual targets |
229 |
| Editing an iSCSI Target |
229 |
| Searching for a specific Fibre Channel target |
230 |
| Viewing iSCSI Initiators |
230 |
| Discovery Domain management |
231 |
| About Discovery Domains (DD) |
231 |
| Creating a discovery domain |
232 |
| Editing a discovery domain |
233 |
| Discovery domain sets (DDSet) |
233 |
| Creating a discovery domain set |
233 |
| Editing a Discovery Domain Set |
234 |
| CHAP Configuration |
234 |
| Creating a CHAP user |
235 |
| Editing a CHAP secret |
235 |
| Binding or Removing CHAP users |
236 |
| iSCSI Fibre Channel Zone configuration |
236 |
| Creating an iSCSI Fibre Channel zone with no effective zone configuration |
237 |
| Creating an iSCSI Fibre Channel zone with an effective zone configuration |
237 |
| Managing and Troubleshooting Accessibility |
238 |
| Routing Traffic |
239 |
| In this chapter |
239 |
| Routing overview |
239 |
| Viewing Fabric Shortest Path First routing |
240 |
| Configuring dynamic load sharing |
240 |
| Specifying frame order delivery |
241 |
| Configuring the link cost for a port |
242 |
| Configuring Standard Security Features |
243 |
| In this chapter |
243 |
| User-defined accounts |
243 |
| Virtual Fabrics considerations |
244 |
| Admin Domain considerations |
244 |
| Viewing user account information |
245 |
| Creating user-defined accounts |
245 |
| Deleting user-defined accounts |
247 |
| Changing user account parameters |
248 |
| Maintaining passwords |
249 |
| Access control list policy configuration |
253 |
| Virtual Fabrics considerations |
253 |
| Admin Domain considerations |
253 |
| Creating an SCC, DCC, or FCS policy |
254 |
| Editing an SCC, DCC, or FCS policy |
255 |
| Deleting an SCC, DCC, or FCS policy |
255 |
| Activating an SCC, DCC, or FCS policy |
255 |
| Distributing an FCS policy |
256 |
| Moving an FCS policy switch position |
256 |
| Authentication policy configuration |
257 |
| Configuring authentication policies for E_Ports |
257 |
| Configuring authentication policies for F_Ports |
257 |
| Distributing authentication policies |
258 |
| Re-authenticating policies |
258 |
| Setting a shared secret key pair |
258 |
| Modifying a shared secret key pair |
259 |
| Setting the Switch Policy Authentication Mode |
259 |
| SNMP configuration |
260 |
| Setting SNMP Trap Levels |
260 |
| Changing the systemGroup configuration parameters |
261 |
| Setting SNMPv1 configuration parameters |
261 |
| Setting SNMPv3 configuration parameters |
261 |
| Changing the access control configuration |
261 |
| RADIUS service management |
262 |
| Enabling and Disabling RADIUS Service |
263 |
| Configuring the RADIUS Service |
264 |
| Modifying the RADIUS Server |
264 |
| Modifying the RADIUS Server Order |
265 |
| Removing a RADIUS Server |
265 |
| Active Directory service management |
265 |
| Enabling Active Directory service |
265 |
| Modifying Active Directory service |
266 |
| Removing Active Directory service |
266 |
| IPSec Concepts |
267 |
| Transport mode and tunnel mode |
268 |
| IPSec header options |
269 |
| Basic IPSec configurations |
270 |
| Internet Key Exchange (IKE) Concepts |
271 |
| IPSec over FCIP |
274 |
| Accessing the IPSec Policies dialog box |
274 |
| Establishing an IKE policy for an FCIP tunnel |
275 |
| Establishing an IPSec policy for an FCIP tunnel |
276 |
| IPSec over management ports |
277 |
| Accessing the Ethernet IPSec Policies dialog box |
277 |
| Enabling IPSec |
278 |
| Establishing an IKE policy |
278 |
| Creating a security association (SA) |
279 |
| Creating an SA proposal |
280 |
| Adding an IPSec transform policy |
281 |
| Adding an IPSec selector |
283 |
| Manually creating an SA |
285 |
| Editing an IKE or IPSec policy |
286 |
| Deleting an IKE or IPSec policy |
286 |
| Establishing authentication policies for HBAs |
287 |
| Administering FICON CUP Fabrics |
291 |
| In this chapter |
291 |
| FICON CUP fabrics overview |
291 |
| Enabling port-based routing |
292 |
| Enabling or disabling FICON Management Server mode |
293 |
| FMS parameter configuration |
294 |
| Configuring FMS mode parameters |
295 |
| Displaying code page information |
295 |
| Viewing the control device state |
296 |
| CUP port connectivity configuration |
297 |
| Viewing CUP Port Connectivity Configurations |
297 |
| Creating or Editing CUP Port Connectivity Configurations |
297 |
| Activating a CUP Port Connectivity Configuration |
299 |
| Copying a CUP Port Connectivity Configuration |
299 |
| Deleting a CUP Port Connectivity Configuration |
300 |
| Displaying Request Node Identification Data (RNID) |
300 |
| Limitations |
303 |
| In this chapter |
303 |
| General Web Tools limitations |
303 |
 1
1 142
142 143
143 144
144 145
145 146
146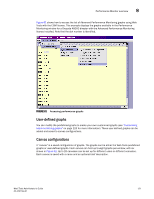 147
147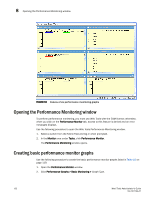 148
148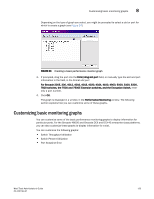 149
149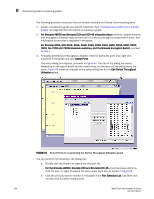 150
150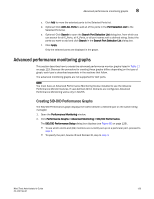 151
151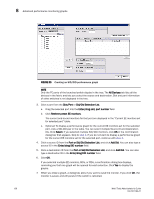 152
152