Garmin GPSMAP 740/740s Owner's Manual - Page 77
Depth Log, Transducer Temperature Log, Setting the Depth Log Range and Time Scales
 |
View all Garmin GPSMAP 740/740s manuals
Add to My Manuals
Save this manual to your list of manuals |
Page 77 highlights
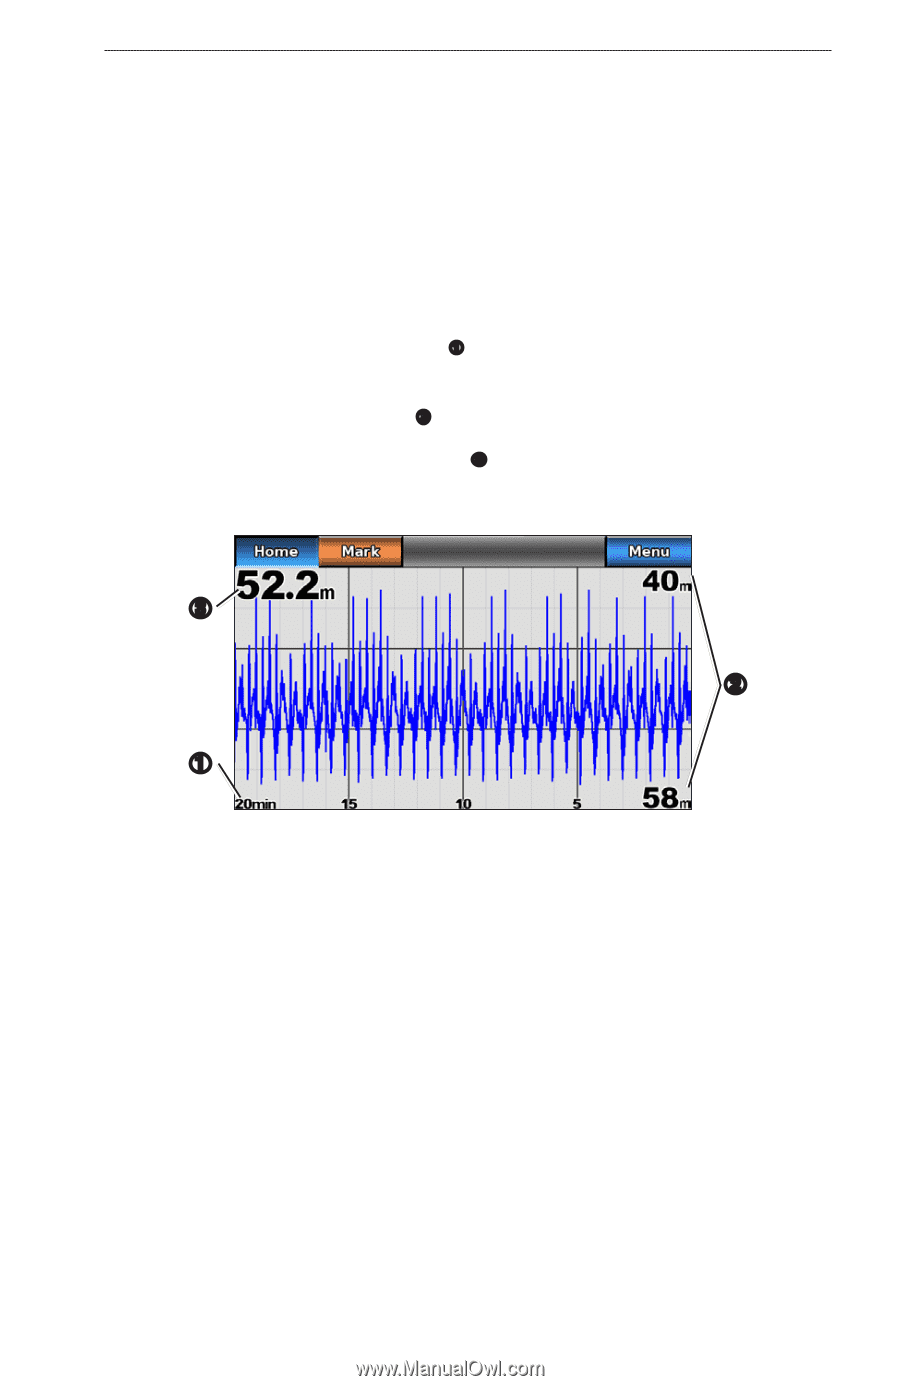
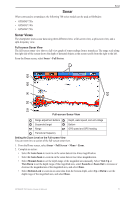
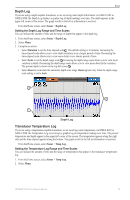
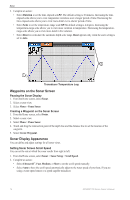
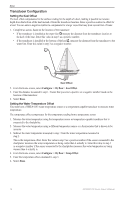
Sonar Depth Log If you are using a depth-capable transducer, or are receiving water depth information via NMEA 0183 or NMEA 2000, the Depth Log displays a graphic log of depth readings over time. The depth appears in the upper-left corner of the screen. The graph scrolls to the left as information is received. From the Home screen, select Sonar > Depth Log. Setting the Depth Log Range and Time Scales You can indicate the amount of time and the range of depth that appear in the depth log. 1. From the Home screen, select Sonar > Depth Log. 2. Select Menu. 3. Complete an action: • Select Duration to set the time-elapsed scale ➊. The default setting is 10 minutes. Increasing the time-elapsed scale allows you to view depth variations over a longer period of time. Decreasing the time-elapsed scale allows you to view more detail over a shorter period of time. • Select Scale to set the depth-range scale ➋. Increasing the depth-range scale allows you to view more variation in depth. Decreasing the depth-range scale allows you to view more detail in the variation. The present depth is shown in the top-left corner ➌. • Select Reset to recalculate the automatic depth scale range. Reset appears only when the depth-range scale setting is set to Auto. ➌ ➋ ➊ Depth Log Transducer Temperature Log If you are using a temperature-capable transducer, or are receiving water temperature via NMEA 0183 or NMEA 2000, the Temperature Log screen keeps a graphic log of temperature readings over time. The present temperature and depth appear in the upper-left corner of the screen. The temperature appears along the right side and the time elapsed appears along the bottom. The graph scrolls to the left as information is received. From the Home screen, select Sonar > Temp Log. Setting the Temperature Log Range and Time Scales You can indicate the amount of time and the range of temperatures that appear in the transducer temperature log. 1. From the Home screen, select Sonar > Temp Log. 2. Select Menu. GPSMAP 700 Series Owner's Manual 73
-
 1
1 -
2
-
3
-
4
-
5
-
6
-
7
-
8
-
9
-
10
-
11
-
12
-
13
-
14
-
15
-
16
-
17
-
18
-
19
-
20
-
21
-
22
-
23
-
24
-
25
-
26
-
27
-
28
-
29
-
30
-
31
-
32
-
33
-
34
-
35
-
36
-
37
-
38
-
39
-
40
-
41
-
42
-
43
-
44
-
45
-
46
-
47
-
48
-
49
-
50
-
51
-
52
-
53
-
54
-
55
-
56
-
57
-
58
-
59
-
60
-
61
-
62
-
63
-
64
-
65
-
66
-
67
-
68
-
69
-
70
-
71
-
 72
72 -
 73
73 -
 74
74 -
 75
75 -
 76
76 -
 77
77 -
 78
78 -
 79
79 -
 80
80 -
 81
81 -
 82
82 -
83
-
84
-
85
-
86
-
87
-
88
-
89
-
90
-
91
-
92
-
93
-
94
-
95
-
96
-
97
-
98
-
99
-
100
 |
 |