D-Link DSN-540 Software User's Guide for DSN-1100-10 - Page 95
Using the Detail Tabs, Viewing System Summary Information Summary Tab, Viewing Historical
 |
UPC - 790069324017
View all D-Link DSN-540 manuals
Add to My Manuals
Save this manual to your list of manuals |
Page 95 highlights
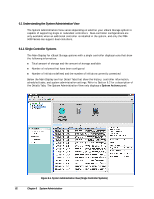
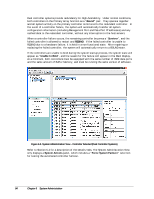
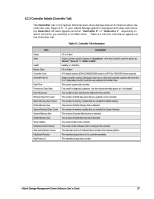
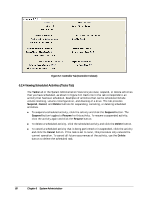
6.2 Using the Detail Tabs System Administration View provides the following Detail Tabs: The Summary tab shows an overview of system resources. See section 6.2.1. The History tab shows historical information. See section 6.2.2. The Controller tab shows hardware and software revisions and status of the controller. See section 6.2.3. The Tasks tab shows the status of tasks that have been scheduled. See section 6.2.4. The Control tab lets you: - Save the current xStack Storage configuration. See section 6.2.5. - Restore a previously saved configuration file. See section 6.2.6. - Restoring factory default settings. See section 6.2.7 - Upgrade software. See section 6.2.8. - Restart the xStack Storage. See section 6.2.9. - Shut down the xStack Storage. See section 6.2.10. The System Policy tab lets you specify a battery policy. See section 6.2.11 The User Accounts tab lets you setup Administrative and User accounts. See sections 6.2.12 and 3.4. The Advanced Settings tab lets you view and change system settings. See section 6.2.13. 6.2.1 Viewing System Summary Information (Summary Tab) The Summary tab in the System Administration View shows the following general statistics about the system: Total amount of storage and the amount of storage available Number of volumes that have been configured Number of initiators defined and the number of initiators currently connected The current Write-Cache mode (Write-Through or Write-Back) The Summary tab only appears for dual-controller systems. This is the same summary information that appears in the Main View of single-controller systems. 6.2.2 Viewing Historical Information (History Tab) The History tab in the System Administration View provides an historical list of informational, warning, and error items (see Figure 6-4). Each row in the tab corresponds to an item. The items are date and time stamped, with the most recent item appearing at the top of the list. The time zone configured for the array appears in parentheses on the tab label; in Figure 6-4, the array is configured for Pacific Daylight Time (PDT). The icon in the left column indicates the severity of the item (Information, Warning or Error). When you select an item, detailed information about the item appears on the right side of the tab. xStack Storage Management Center Software User's Guide 85
-
 1
1 -
2
-
3
-
4
-
5
-
6
-
7
-
8
-
9
-
10
-
11
-
12
-
13
-
14
-
15
-
16
-
17
-
18
-
19
-
20
-
21
-
22
-
23
-
24
-
25
-
26
-
27
-
28
-
29
-
30
-
31
-
32
-
33
-
34
-
35
-
36
-
37
-
38
-
39
-
40
-
41
-
42
-
43
-
44
-
45
-
46
-
47
-
48
-
49
-
50
-
51
-
52
-
53
-
54
-
55
-
56
-
57
-
58
-
59
-
60
-
61
-
62
-
63
-
64
-
65
-
66
-
67
-
68
-
69
-
70
-
71
-
72
-
73
-
74
-
75
-
76
-
77
-
78
-
79
-
80
-
81
-
82
-
83
-
84
-
85
-
86
-
87
-
88
-
89
-
 90
90 -
 91
91 -
 92
92 -
 93
93 -
 94
94 -
 95
95 -
 96
96 -
 97
97 -
 98
98 -
 99
99 -
 100
100 -
101
-
102
-
103
-
104
-
105
-
106
-
107
-
108
-
109
-
110
-
111
-
112
-
113
-
114
-
115
-
116
-
117
-
118
-
119
-
120
-
121
-
122
-
123
-
124
-
125
-
126
-
127
-
128
-
129
-
130
-
131
-
132
-
133
-
134
-
135
-
136
-
137
-
138
-
139
-
140
-
141
-
142
-
143
-
144
-
145
-
146
-
147
-
148
-
149
-
150
-
151
-
152
-
153
-
154
-
155
-
156
-
157
-
158
 |
 |