Epson FX-185 User Manual - Page 195
Ones become dots
 |
View all Epson FX-185 manuals
Add to My Manuals
Save this manual to your list of manuals |
Page 195 highlights
The final step to plotting a circle in an array is to close the loops and display the contents of the array. Add these three lines to your program: 50 LPRENT A(R,C);: NEXT C: LPRINT 60 PRINT "ROW";R: NEXT R 170 LPRINT CHR$(27)"@": END and RUN it. Figure 13-6. Displaying an array The printout shows, in terms of ones and zeros, the results of your planning and your program's plotting. Ones become dots Next you need to translate the contents of the array to dots on the paper. First, modify line 50 so that it no longer prints out the contents of the array: 50 NEXT C Then fill the usual graphics prescription for 7-dot line spacing: 70 LPRINT CHR$(27)"1"CHR$(7); The CHR$(7) sounds the beeper to tell you when the array is full. 178
-
 1
1 -
2
-
3
-
4
-
5
-
6
-
7
-
8
-
9
-
10
-
11
-
12
-
13
-
14
-
15
-
16
-
17
-
18
-
19
-
20
-
21
-
22
-
23
-
24
-
25
-
26
-
27
-
28
-
29
-
30
-
31
-
32
-
33
-
34
-
35
-
36
-
37
-
38
-
39
-
40
-
41
-
42
-
43
-
44
-
45
-
46
-
47
-
48
-
49
-
50
-
51
-
52
-
53
-
54
-
55
-
56
-
57
-
58
-
59
-
60
-
61
-
62
-
63
-
64
-
65
-
66
-
67
-
68
-
69
-
70
-
71
-
72
-
73
-
74
-
75
-
76
-
77
-
78
-
79
-
80
-
81
-
82
-
83
-
84
-
85
-
86
-
87
-
88
-
89
-
90
-
91
-
92
-
93
-
94
-
95
-
96
-
97
-
98
-
99
-
100
-
101
-
102
-
103
-
104
-
105
-
106
-
107
-
108
-
109
-
110
-
111
-
112
-
113
-
114
-
115
-
116
-
117
-
118
-
119
-
120
-
121
-
122
-
123
-
124
-
125
-
126
-
127
-
128
-
129
-
130
-
131
-
132
-
133
-
134
-
135
-
136
-
137
-
138
-
139
-
140
-
141
-
142
-
143
-
144
-
145
-
146
-
147
-
148
-
149
-
150
-
151
-
152
-
153
-
154
-
155
-
156
-
157
-
158
-
159
-
160
-
161
-
162
-
163
-
164
-
165
-
166
-
167
-
168
-
169
-
170
-
171
-
172
-
173
-
174
-
175
-
176
-
177
-
178
-
179
-
180
-
181
-
182
-
183
-
184
-
185
-
186
-
187
-
188
-
189
-
 190
190 -
 191
191 -
 192
192 -
 193
193 -
 194
194 -
 195
195 -
 196
196 -
 197
197 -
 198
198 -
 199
199 -
 200
200 -
201
-
202
-
203
-
204
-
205
-
206
-
207
-
208
-
209
-
210
-
211
-
212
-
213
-
214
-
215
-
216
-
217
-
218
-
219
-
220
-
221
-
222
-
223
-
224
-
225
-
226
-
227
-
228
-
229
-
230
-
231
-
232
-
233
-
234
-
235
-
236
-
237
-
238
-
239
-
240
-
241
-
242
-
243
-
244
-
245
-
246
-
247
-
248
-
249
-
250
-
251
-
252
-
253
-
254
-
255
-
256
-
257
-
258
-
259
-
260
-
261
-
262
-
263
-
264
-
265
-
266
-
267
-
268
 |
 |
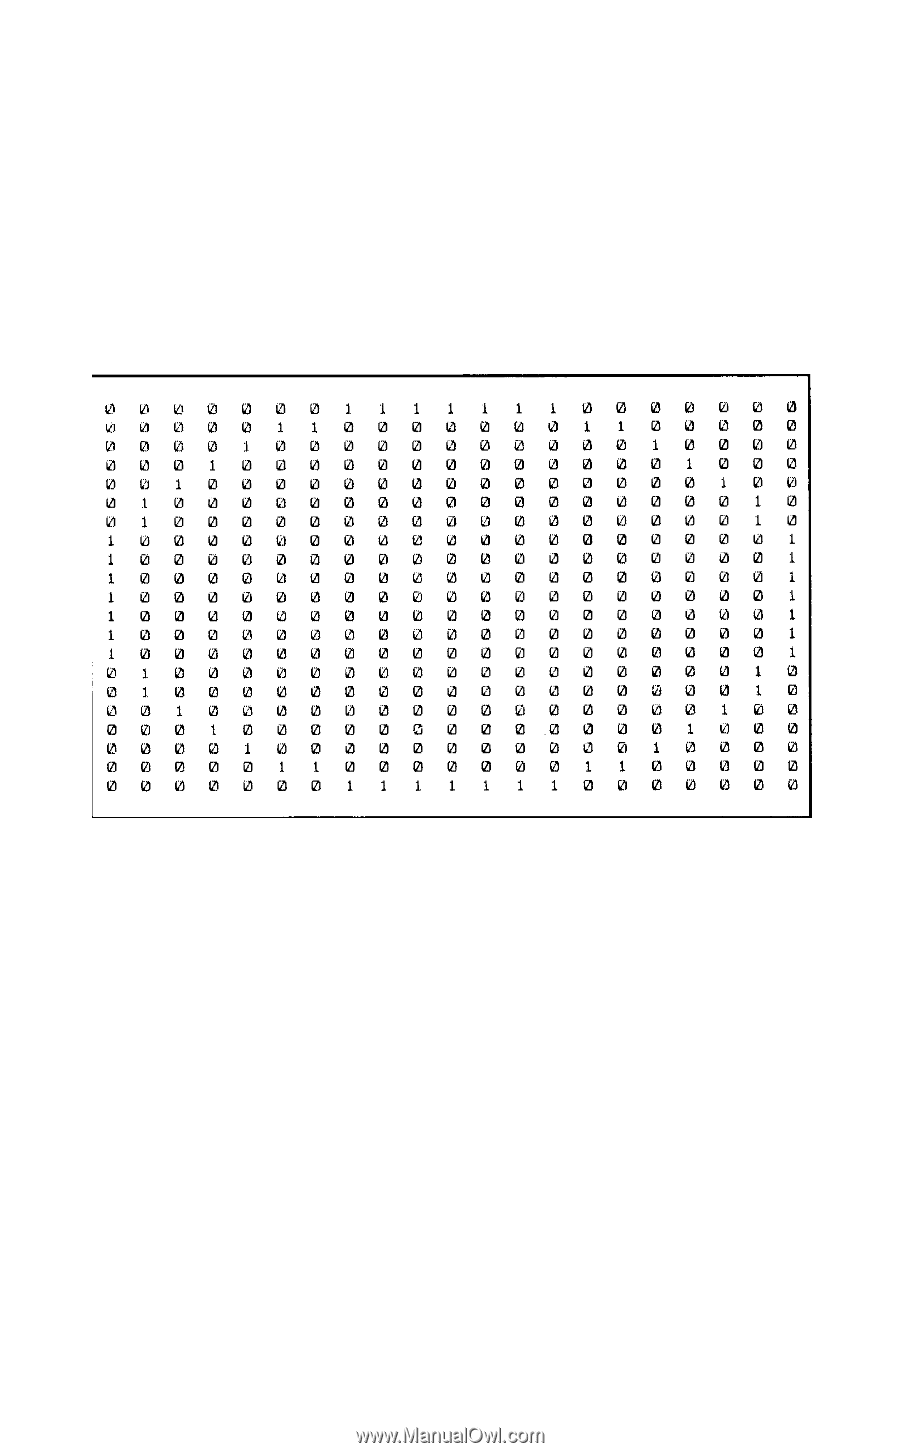
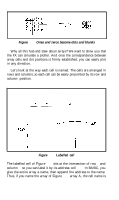
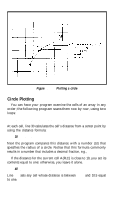
The final step to plotting a circle in an array is to close the loops
and display the contents of the array. Add these three lines to your
program:
50
LPRENT A(R,C);: NEXT C: LPRINT
60
PRINT "ROW";R: NEXT R
170 LPRINT CHR$(27)"@": END
and RUN it.
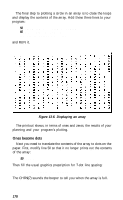
Figure 13-6. Displaying an array
The printout shows, in terms of ones and zeros, the results of your
planning and your program’s plotting.
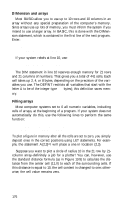
Ones become dots
Next you need to translate the contents of the array to dots on the
paper. First, modify line 50 so that it no longer prints out the contents
of the array:
50
NEXT C
Then fill the usual graphics prescription for 7-dot line spacing:
70 LPRINT CHR$(27)"1"CHR$(7);
The CHR$(7) sounds the beeper to tell you when the array is full.
178