Texas Instruments TI-84 PLUS SILV Guidebook - Page 219
Statistical Plotting in a Program, Turning On and Turning Off Stat Plots, Defining the Viewing Window
 |
View all Texas Instruments TI-84 PLUS SILV manuals
Add to My Manuals
Save this manual to your list of manuals |
Page 219 highlights
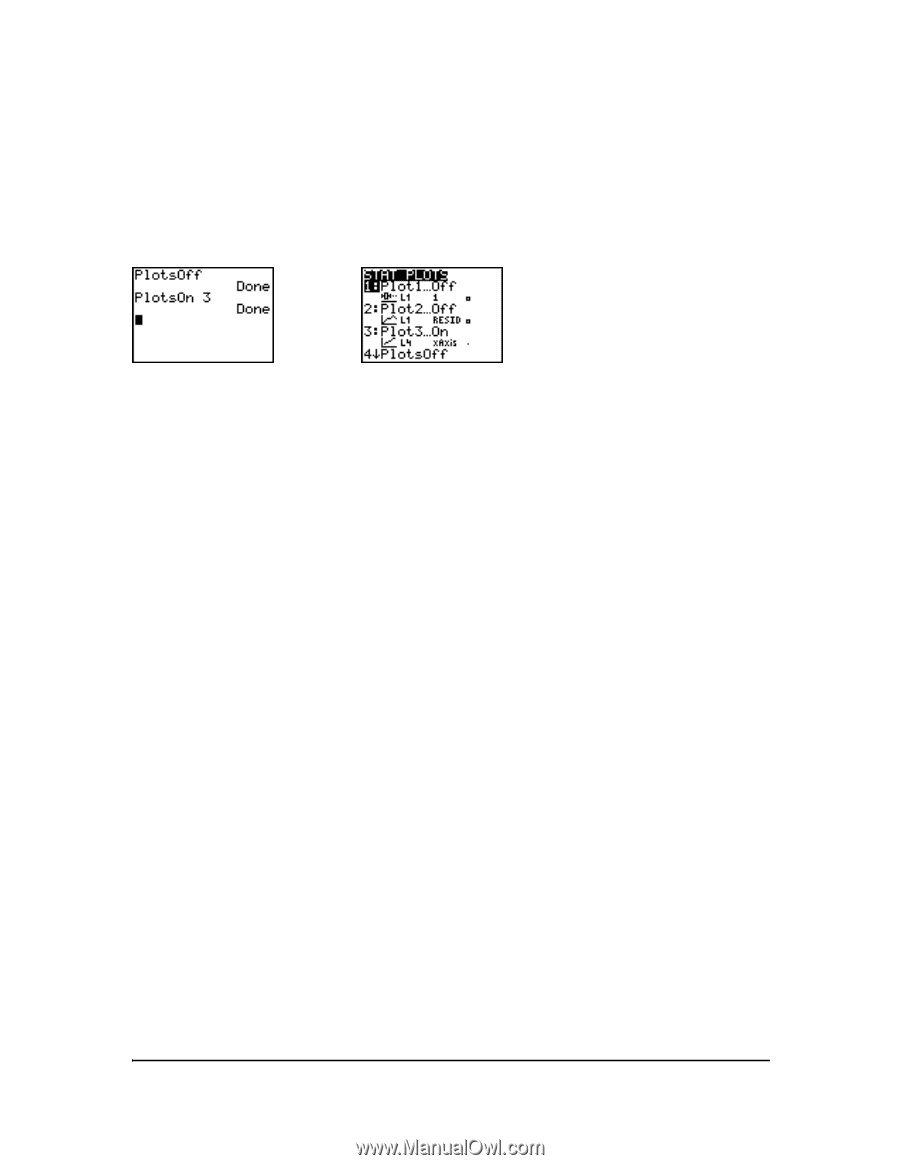
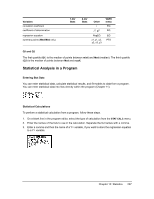
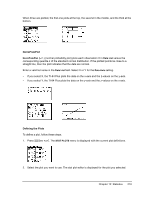
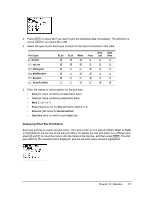
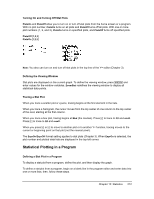
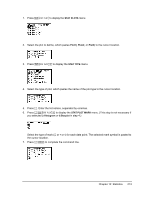
Turning On and Turning Off Stat Plots PlotsOn and PlotsOff allow you to turn on or turn off stat plots from the home screen or a program. With no plot number, PlotsOn turns on all plots and PlotsOff turns off all plots. With one or more plot numbers (1, 2, and 3), PlotsOn turns on specified plots, and PlotsOff turns off specified plots. PlotsOff [1,2,3] PlotsOn [1,2,3] Note: You also can turn on and turn off stat plots in the top line of the Y= editor (Chapter 3). Defining the Viewing Window Stat plots are displayed on the current graph. To define the viewing window, press p and enter values for the window variables. ZoomStat redefines the viewing window to display all statistical data points. Tracing a Stat Plot When you trace a scatter plot or xyLine, tracing begins at the first element in the lists. When you trace a histogram, the cursor moves from the top center of one column to the top center of the next, starting at the first column. When you trace a box plot, tracing begins at Med (the median). Press | to trace to Q1 and minX. Press ~ to trace to Q3 and maxX. When you press } or † to move to another plot or to another Y= function, tracing moves to the current or beginning point on that plot (not the nearest pixel). The ExprOn/ExprOff format setting applies to stat plots (Chapter 3). When ExprOn is selected, the plot number and plotted data lists are displayed in the top-left corner. Statistical Plotting in a Program Defining a Stat Plot in a Program To display a stat plot from a program, define the plot, and then display the graph. To define a stat plot from a program, begin on a blank line in the program editor and enter data into one or more lists; then, follow these steps. Chapter 12: Statistics 212
-
 1
1 -
2
-
3
-
4
-
5
-
6
-
7
-
8
-
9
-
10
-
11
-
12
-
13
-
14
-
15
-
16
-
17
-
18
-
19
-
20
-
21
-
22
-
23
-
24
-
25
-
26
-
27
-
28
-
29
-
30
-
31
-
32
-
33
-
34
-
35
-
36
-
37
-
38
-
39
-
40
-
41
-
42
-
43
-
44
-
45
-
46
-
47
-
48
-
49
-
50
-
51
-
52
-
53
-
54
-
55
-
56
-
57
-
58
-
59
-
60
-
61
-
62
-
63
-
64
-
65
-
66
-
67
-
68
-
69
-
70
-
71
-
72
-
73
-
74
-
75
-
76
-
77
-
78
-
79
-
80
-
81
-
82
-
83
-
84
-
85
-
86
-
87
-
88
-
89
-
90
-
91
-
92
-
93
-
94
-
95
-
96
-
97
-
98
-
99
-
100
-
101
-
102
-
103
-
104
-
105
-
106
-
107
-
108
-
109
-
110
-
111
-
112
-
113
-
114
-
115
-
116
-
117
-
118
-
119
-
120
-
121
-
122
-
123
-
124
-
125
-
126
-
127
-
128
-
129
-
130
-
131
-
132
-
133
-
134
-
135
-
136
-
137
-
138
-
139
-
140
-
141
-
142
-
143
-
144
-
145
-
146
-
147
-
148
-
149
-
150
-
151
-
152
-
153
-
154
-
155
-
156
-
157
-
158
-
159
-
160
-
161
-
162
-
163
-
164
-
165
-
166
-
167
-
168
-
169
-
170
-
171
-
172
-
173
-
174
-
175
-
176
-
177
-
178
-
179
-
180
-
181
-
182
-
183
-
184
-
185
-
186
-
187
-
188
-
189
-
190
-
191
-
192
-
193
-
194
-
195
-
196
-
197
-
198
-
199
-
200
-
201
-
202
-
203
-
204
-
205
-
206
-
207
-
208
-
209
-
210
-
211
-
212
-
213
-
 214
214 -
 215
215 -
 216
216 -
 217
217 -
 218
218 -
 219
219 -
 220
220 -
 221
221 -
 222
222 -
 223
223 -
 224
224 -
225
-
226
-
227
-
228
-
229
-
230
-
231
-
232
-
233
-
234
-
235
-
236
-
237
-
238
-
239
-
240
-
241
-
242
-
243
-
244
-
245
-
246
-
247
-
248
-
249
-
250
-
251
-
252
-
253
-
254
-
255
-
256
-
257
-
258
-
259
-
260
-
261
-
262
-
263
-
264
-
265
-
266
-
267
-
268
-
269
-
270
-
271
-
272
-
273
-
274
-
275
-
276
-
277
-
278
-
279
-
280
-
281
-
282
-
283
-
284
-
285
-
286
-
287
-
288
-
289
-
290
-
291
-
292
-
293
-
294
-
295
-
296
-
297
-
298
-
299
-
300
-
301
-
302
-
303
-
304
-
305
-
306
-
307
-
308
-
309
-
310
-
311
-
312
-
313
-
314
-
315
-
316
-
317
-
318
-
319
-
320
-
321
-
322
-
323
-
324
-
325
-
326
-
327
-
328
-
329
-
330
-
331
-
332
-
333
-
334
-
335
-
336
-
337
-
338
-
339
-
340
-
341
-
342
-
343
-
344
-
345
-
346
-
347
-
348
-
349
-
350
-
351
-
352
-
353
-
354
-
355
-
356
-
357
-
358
-
359
-
360
-
361
-
362
-
363
-
364
-
365
-
366
-
367
-
368
-
369
-
370
-
371
-
372
-
373
-
374
-
375
-
376
-
377
-
378
-
379
-
380
-
381
-
382
-
383
-
384
-
385
-
386
-
387
-
388
-
389
-
390
-
391
-
392
-
393
-
394
-
395
-
396
-
397
-
398
-
399
-
400
-
401
-
402
-
403
-
404
-
405
-
406
-
407
-
408
-
409
-
410
-
411
-
412
-
413
-
414
-
415
-
416
-
417
-
418
-
419
-
420
-
421
-
422
 |
 |