Texas Instruments TI-84 PLUS SILV Guidebook - Page 226
Selecting Data or Stats, Entering the Values for Arguments, Selecting an Alternative Hypothesis
 |
View all Texas Instruments TI-84 PLUS SILV manuals
Add to My Manuals
Save this manual to your list of manuals |
Page 226 highlights
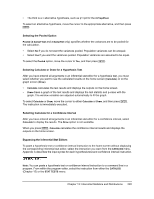
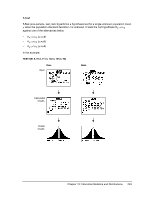
1. Select a hypothesis test or confidence interval from the STAT TESTS menu. The appropriate editor is displayed. 2. Select Data or Stats input, if the selection is available. The appropriate editor is displayed. 3. Enter real numbers, list names, or expressions for each argument in the editor. 4. Select the alternative hypothesis (ƒÄ, ) against which to test, if the selection is available. 5. Select No or Yes for the Pooled option, if the selection is available. 6. Select Calculate or Draw (when Draw is available) to execute the instruction. • When you select Calculate, the results are displayed on the home screen. • When you select Draw, the results are displayed in a graph. This chapter describes the selections in the above steps for each hypothesis test and confidence interval instruction. Select Data or Stats input Enter values for arguments Select an alternative hypothesis Select Calculate or Draw output Selecting Data or Stats Most inferential stat editors prompt you to select one of two types of input. (1-PropZInt and 2-PropZTest, 1-PropZInt and 2-PropZInt, c2-Test, c2GOF-Test, LinRegTInt, and LinRegTTest do not.) • Select Data to enter the data lists as input. • Select Stats to enter summary statistics, such as v, Sx, and n, as input. To select Data or Stats, move the cursor to either Data or Stats, and then press Í. Entering the Values for Arguments Inferential stat editors require a value for every argument. If you do not know what a particular argument symbol represents, see the Inferential Statistics Input Descriptions tables. When you enter values in any inferential stat editor, the TI-84 Plus stores them in memory so that you can run many tests or intervals without having to reenter every value. Selecting an Alternative Hypothesis (ă < >) Most of the inferential stat editors for the hypothesis tests prompt you to select one of three alternative hypotheses. • The first is a ƒ alternative hypothesis, such as mƒm0 for the Z-Test. • The second is a < alternative hypothesis, such as m1
-
 1
1 -
2
-
3
-
4
-
5
-
6
-
7
-
8
-
9
-
10
-
11
-
12
-
13
-
14
-
15
-
16
-
17
-
18
-
19
-
20
-
21
-
22
-
23
-
24
-
25
-
26
-
27
-
28
-
29
-
30
-
31
-
32
-
33
-
34
-
35
-
36
-
37
-
38
-
39
-
40
-
41
-
42
-
43
-
44
-
45
-
46
-
47
-
48
-
49
-
50
-
51
-
52
-
53
-
54
-
55
-
56
-
57
-
58
-
59
-
60
-
61
-
62
-
63
-
64
-
65
-
66
-
67
-
68
-
69
-
70
-
71
-
72
-
73
-
74
-
75
-
76
-
77
-
78
-
79
-
80
-
81
-
82
-
83
-
84
-
85
-
86
-
87
-
88
-
89
-
90
-
91
-
92
-
93
-
94
-
95
-
96
-
97
-
98
-
99
-
100
-
101
-
102
-
103
-
104
-
105
-
106
-
107
-
108
-
109
-
110
-
111
-
112
-
113
-
114
-
115
-
116
-
117
-
118
-
119
-
120
-
121
-
122
-
123
-
124
-
125
-
126
-
127
-
128
-
129
-
130
-
131
-
132
-
133
-
134
-
135
-
136
-
137
-
138
-
139
-
140
-
141
-
142
-
143
-
144
-
145
-
146
-
147
-
148
-
149
-
150
-
151
-
152
-
153
-
154
-
155
-
156
-
157
-
158
-
159
-
160
-
161
-
162
-
163
-
164
-
165
-
166
-
167
-
168
-
169
-
170
-
171
-
172
-
173
-
174
-
175
-
176
-
177
-
178
-
179
-
180
-
181
-
182
-
183
-
184
-
185
-
186
-
187
-
188
-
189
-
190
-
191
-
192
-
193
-
194
-
195
-
196
-
197
-
198
-
199
-
200
-
201
-
202
-
203
-
204
-
205
-
206
-
207
-
208
-
209
-
210
-
211
-
212
-
213
-
214
-
215
-
216
-
217
-
218
-
219
-
220
-
 221
221 -
 222
222 -
 223
223 -
 224
224 -
 225
225 -
 226
226 -
 227
227 -
 228
228 -
 229
229 -
 230
230 -
 231
231 -
232
-
233
-
234
-
235
-
236
-
237
-
238
-
239
-
240
-
241
-
242
-
243
-
244
-
245
-
246
-
247
-
248
-
249
-
250
-
251
-
252
-
253
-
254
-
255
-
256
-
257
-
258
-
259
-
260
-
261
-
262
-
263
-
264
-
265
-
266
-
267
-
268
-
269
-
270
-
271
-
272
-
273
-
274
-
275
-
276
-
277
-
278
-
279
-
280
-
281
-
282
-
283
-
284
-
285
-
286
-
287
-
288
-
289
-
290
-
291
-
292
-
293
-
294
-
295
-
296
-
297
-
298
-
299
-
300
-
301
-
302
-
303
-
304
-
305
-
306
-
307
-
308
-
309
-
310
-
311
-
312
-
313
-
314
-
315
-
316
-
317
-
318
-
319
-
320
-
321
-
322
-
323
-
324
-
325
-
326
-
327
-
328
-
329
-
330
-
331
-
332
-
333
-
334
-
335
-
336
-
337
-
338
-
339
-
340
-
341
-
342
-
343
-
344
-
345
-
346
-
347
-
348
-
349
-
350
-
351
-
352
-
353
-
354
-
355
-
356
-
357
-
358
-
359
-
360
-
361
-
362
-
363
-
364
-
365
-
366
-
367
-
368
-
369
-
370
-
371
-
372
-
373
-
374
-
375
-
376
-
377
-
378
-
379
-
380
-
381
-
382
-
383
-
384
-
385
-
386
-
387
-
388
-
389
-
390
-
391
-
392
-
393
-
394
-
395
-
396
-
397
-
398
-
399
-
400
-
401
-
402
-
403
-
404
-
405
-
406
-
407
-
408
-
409
-
410
-
411
-
412
-
413
-
414
-
415
-
416
-
417
-
418
-
419
-
420
-
421
-
422
 |
 |
