Texas Instruments TI-84 PLUS SILV Guidebook - Page 384
can be real numbers, expressions, or lists., Displays a graph, lets you draw a box that defines a new
 |
View all Texas Instruments TI-84 PLUS SILV manuals
Add to My Manuals
Save this manual to your list of manuals |
Page 384 highlights
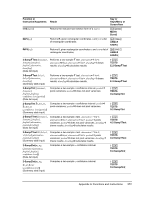
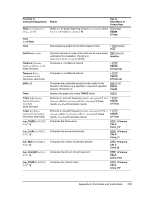
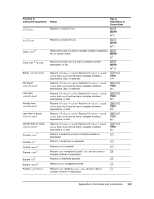
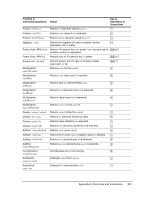
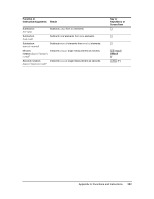
Function or Instruction/Arguments UnArchive Un/d uvAxes uwAxes 1-Var Stats [Xlistname, freqlist] 2-Var Stats [Xlistname, Ylistname,freqlist] variance(list[,freqlist]) Vertical x vwAxes Web :While condition :commands :End :command valueA xor valueB ZBox ZDecimal ZFrac 1/2 Result Key or Keys/Menu or Screen/Item Moves the specified variables from the user data archive memory to RAM. To archive variables, use Archive. y L 6:UnArchive Displays results as a mixed number, if applicable. NUM C: Un/d Sets sequence graphs to plot u(n) on the x-axis and v(n) † y . on the y-axis. uv Sets sequence graphs to plot u(n) on the x-axis and w(n) † y . on the y-axis. uw Performs one-variable analysis on the data in Xlistname with frequency freqlist. ... CALC 1:1-Var Stats Performs two-variable analysis on the data in Xlistname and Ylistname with frequency freqlist. ... CALC 2:2-Var Stats Returns the variance of the elements in list with frequency y 9 freqlist. MATH 8:variance( Draws a vertical line at x. y < DRAW 4:Vertical Sets sequence graphs to plot v(n) on the x-axis and w(n) † y . on the y-axis. vw Sets sequence graphs to trace as webs. † y . Web Executes commands while condition is true. † CTL 5:While Returns 1 if only valueA or valueB = 0. valueA and valueB can be real numbers, expressions, or lists. y : LOGIC 3:xor Displays a graph, lets you draw a box that defines a new viewing window, and updates the window. † q ZOOM 1:ZBox Adjusts the viewing window so that @X=0.1 and @Y=0.1, † q and displays the graph screen with the origin centered on ZOOM the screen. 4:ZDecimal Sets the window variables so that you can trace in increments of , if possible. Sets @X and @Y to . q ZOOM B:ZFrac1/2 Appendix A: Functions and Instructions 377
-
 1
1 -
2
-
3
-
4
-
5
-
6
-
7
-
8
-
9
-
10
-
11
-
12
-
13
-
14
-
15
-
16
-
17
-
18
-
19
-
20
-
21
-
22
-
23
-
24
-
25
-
26
-
27
-
28
-
29
-
30
-
31
-
32
-
33
-
34
-
35
-
36
-
37
-
38
-
39
-
40
-
41
-
42
-
43
-
44
-
45
-
46
-
47
-
48
-
49
-
50
-
51
-
52
-
53
-
54
-
55
-
56
-
57
-
58
-
59
-
60
-
61
-
62
-
63
-
64
-
65
-
66
-
67
-
68
-
69
-
70
-
71
-
72
-
73
-
74
-
75
-
76
-
77
-
78
-
79
-
80
-
81
-
82
-
83
-
84
-
85
-
86
-
87
-
88
-
89
-
90
-
91
-
92
-
93
-
94
-
95
-
96
-
97
-
98
-
99
-
100
-
101
-
102
-
103
-
104
-
105
-
106
-
107
-
108
-
109
-
110
-
111
-
112
-
113
-
114
-
115
-
116
-
117
-
118
-
119
-
120
-
121
-
122
-
123
-
124
-
125
-
126
-
127
-
128
-
129
-
130
-
131
-
132
-
133
-
134
-
135
-
136
-
137
-
138
-
139
-
140
-
141
-
142
-
143
-
144
-
145
-
146
-
147
-
148
-
149
-
150
-
151
-
152
-
153
-
154
-
155
-
156
-
157
-
158
-
159
-
160
-
161
-
162
-
163
-
164
-
165
-
166
-
167
-
168
-
169
-
170
-
171
-
172
-
173
-
174
-
175
-
176
-
177
-
178
-
179
-
180
-
181
-
182
-
183
-
184
-
185
-
186
-
187
-
188
-
189
-
190
-
191
-
192
-
193
-
194
-
195
-
196
-
197
-
198
-
199
-
200
-
201
-
202
-
203
-
204
-
205
-
206
-
207
-
208
-
209
-
210
-
211
-
212
-
213
-
214
-
215
-
216
-
217
-
218
-
219
-
220
-
221
-
222
-
223
-
224
-
225
-
226
-
227
-
228
-
229
-
230
-
231
-
232
-
233
-
234
-
235
-
236
-
237
-
238
-
239
-
240
-
241
-
242
-
243
-
244
-
245
-
246
-
247
-
248
-
249
-
250
-
251
-
252
-
253
-
254
-
255
-
256
-
257
-
258
-
259
-
260
-
261
-
262
-
263
-
264
-
265
-
266
-
267
-
268
-
269
-
270
-
271
-
272
-
273
-
274
-
275
-
276
-
277
-
278
-
279
-
280
-
281
-
282
-
283
-
284
-
285
-
286
-
287
-
288
-
289
-
290
-
291
-
292
-
293
-
294
-
295
-
296
-
297
-
298
-
299
-
300
-
301
-
302
-
303
-
304
-
305
-
306
-
307
-
308
-
309
-
310
-
311
-
312
-
313
-
314
-
315
-
316
-
317
-
318
-
319
-
320
-
321
-
322
-
323
-
324
-
325
-
326
-
327
-
328
-
329
-
330
-
331
-
332
-
333
-
334
-
335
-
336
-
337
-
338
-
339
-
340
-
341
-
342
-
343
-
344
-
345
-
346
-
347
-
348
-
349
-
350
-
351
-
352
-
353
-
354
-
355
-
356
-
357
-
358
-
359
-
360
-
361
-
362
-
363
-
364
-
365
-
366
-
367
-
368
-
369
-
370
-
371
-
372
-
373
-
374
-
375
-
376
-
377
-
378
-
 379
379 -
 380
380 -
 381
381 -
 382
382 -
 383
383 -
 384
384 -
 385
385 -
 386
386 -
 387
387 -
 388
388 -
 389
389 -
390
-
391
-
392
-
393
-
394
-
395
-
396
-
397
-
398
-
399
-
400
-
401
-
402
-
403
-
404
-
405
-
406
-
407
-
408
-
409
-
410
-
411
-
412
-
413
-
414
-
415
-
416
-
417
-
418
-
419
-
420
-
421
-
422
 |
 |
