Texas Instruments TI-84 PLUS SILV Guidebook - Page 314
Activities, Plot1, WLEFT, WRGHT, Xscl=1, Yscl=0, ZoomStat
 |
View all Texas Instruments TI-84 PLUS SILV manuals
Add to My Manuals
Save this manual to your list of manuals |
Page 314 highlights
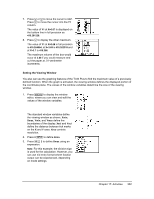
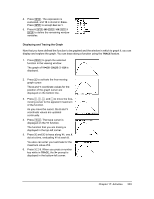
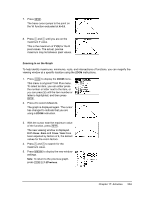
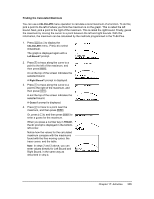
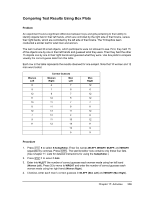
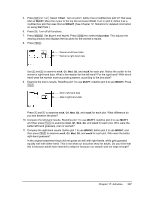
5. Press y ,. Select 1:Plot1. Turn on plot 1; define it as a modified box plot Õ that uses Xlist as WLEFT. Move the cursor to the top line and select Plot2. Turn on plot 2; define it as a modified box plot that uses Xlist as WRGHT. (See Chapter 12: Statistics for detailed information on using Stat Plots.) 6. Press o. Turn off all functions. 7. Press p. Set Xscl=1 and Yscl=0. Press q 9 to select 9:ZoomStat. This adjusts the viewing window and displays the box plots for the women's results. 8. Press r. Women's left-hand data Women's right-hand data Use | and ~ to examine minX, Q1, Med, Q3, and maxX for each plot. Notice the outlier to the women's right-hand data. What is the median for the left hand? For the right hand? With which hand were the women more accurate guessers, according to the box plots? 9. Examine the men's results. Redefine plot 1 to use MLEFT, redefine plot 2 to use MRGHT. Press r. Men's left-hand data Men's right-hand data Press | and ~ to examine minX, Q1, Med, Q3, and maxX for each plot. What difference do you see between the plots? 10. Compare the left-hand results. Redefine plot 1 to use WLEFT, redefine plot 2 to use MLEFT, and then press r to examine minX, Q1, Med, Q3, and maxX for each plot. Who were the better left-hand guessers, men or women? 11. Compare the right-hand results. Define plot 1 to use WRGHT, define plot 2 to use MRGHT, and then press r to examine minX, Q1, Med, Q3, and maxX for each plot. Who were the better right-hand guessers? In the original experiment boys did not guess as well with right hands, while girls guessed equally well with either hand. This is not what our box plots show for adults. Do you think that this is because adults have learned to adapt or because our sample was not large enough? Chapter 17: Activities 307
-
 1
1 -
2
-
3
-
4
-
5
-
6
-
7
-
8
-
9
-
10
-
11
-
12
-
13
-
14
-
15
-
16
-
17
-
18
-
19
-
20
-
21
-
22
-
23
-
24
-
25
-
26
-
27
-
28
-
29
-
30
-
31
-
32
-
33
-
34
-
35
-
36
-
37
-
38
-
39
-
40
-
41
-
42
-
43
-
44
-
45
-
46
-
47
-
48
-
49
-
50
-
51
-
52
-
53
-
54
-
55
-
56
-
57
-
58
-
59
-
60
-
61
-
62
-
63
-
64
-
65
-
66
-
67
-
68
-
69
-
70
-
71
-
72
-
73
-
74
-
75
-
76
-
77
-
78
-
79
-
80
-
81
-
82
-
83
-
84
-
85
-
86
-
87
-
88
-
89
-
90
-
91
-
92
-
93
-
94
-
95
-
96
-
97
-
98
-
99
-
100
-
101
-
102
-
103
-
104
-
105
-
106
-
107
-
108
-
109
-
110
-
111
-
112
-
113
-
114
-
115
-
116
-
117
-
118
-
119
-
120
-
121
-
122
-
123
-
124
-
125
-
126
-
127
-
128
-
129
-
130
-
131
-
132
-
133
-
134
-
135
-
136
-
137
-
138
-
139
-
140
-
141
-
142
-
143
-
144
-
145
-
146
-
147
-
148
-
149
-
150
-
151
-
152
-
153
-
154
-
155
-
156
-
157
-
158
-
159
-
160
-
161
-
162
-
163
-
164
-
165
-
166
-
167
-
168
-
169
-
170
-
171
-
172
-
173
-
174
-
175
-
176
-
177
-
178
-
179
-
180
-
181
-
182
-
183
-
184
-
185
-
186
-
187
-
188
-
189
-
190
-
191
-
192
-
193
-
194
-
195
-
196
-
197
-
198
-
199
-
200
-
201
-
202
-
203
-
204
-
205
-
206
-
207
-
208
-
209
-
210
-
211
-
212
-
213
-
214
-
215
-
216
-
217
-
218
-
219
-
220
-
221
-
222
-
223
-
224
-
225
-
226
-
227
-
228
-
229
-
230
-
231
-
232
-
233
-
234
-
235
-
236
-
237
-
238
-
239
-
240
-
241
-
242
-
243
-
244
-
245
-
246
-
247
-
248
-
249
-
250
-
251
-
252
-
253
-
254
-
255
-
256
-
257
-
258
-
259
-
260
-
261
-
262
-
263
-
264
-
265
-
266
-
267
-
268
-
269
-
270
-
271
-
272
-
273
-
274
-
275
-
276
-
277
-
278
-
279
-
280
-
281
-
282
-
283
-
284
-
285
-
286
-
287
-
288
-
289
-
290
-
291
-
292
-
293
-
294
-
295
-
296
-
297
-
298
-
299
-
300
-
301
-
302
-
303
-
304
-
305
-
306
-
307
-
308
-
 309
309 -
 310
310 -
 311
311 -
 312
312 -
 313
313 -
 314
314 -
 315
315 -
 316
316 -
 317
317 -
 318
318 -
 319
319 -
320
-
321
-
322
-
323
-
324
-
325
-
326
-
327
-
328
-
329
-
330
-
331
-
332
-
333
-
334
-
335
-
336
-
337
-
338
-
339
-
340
-
341
-
342
-
343
-
344
-
345
-
346
-
347
-
348
-
349
-
350
-
351
-
352
-
353
-
354
-
355
-
356
-
357
-
358
-
359
-
360
-
361
-
362
-
363
-
364
-
365
-
366
-
367
-
368
-
369
-
370
-
371
-
372
-
373
-
374
-
375
-
376
-
377
-
378
-
379
-
380
-
381
-
382
-
383
-
384
-
385
-
386
-
387
-
388
-
389
-
390
-
391
-
392
-
393
-
394
-
395
-
396
-
397
-
398
-
399
-
400
-
401
-
402
-
403
-
404
-
405
-
406
-
407
-
408
-
409
-
410
-
411
-
412
-
413
-
414
-
415
-
416
-
417
-
418
-
419
-
420
-
421
-
422
 |
 |
