Texas Instruments TI-84 PLUS SILV Guidebook - Page 227
Selecting Calculate or Draw for a Hypothesis Test, Selecting Calculate for a Confidence Interval
 |
View all Texas Instruments TI-84 PLUS SILV manuals
Add to My Manuals
Save this manual to your list of manuals |
Page 227 highlights
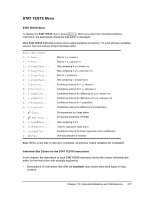
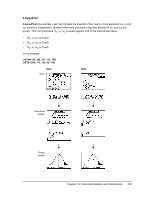
• The third is a > alternative hypothesis, such as p1>p2 for the 2-PropZTest. To select an alternative hypothesis, move the cursor to the appropriate alternative, and then press Í. Selecting the Pooled Option Pooled (2-SampTTest and 2-SampTInt only) specifies whether the variances are to be pooled for the calculation. • Select No if you do not want the variances pooled. Population variances can be unequal. • Select Yes if you want the variances pooled. Population variances are assumed to be equal. To select the Pooled option, move the cursor to Yes, and then press Í. Selecting Calculate or Draw for a Hypothesis Test After you have entered all arguments in an inferential stat editor for a hypothesis test, you must select whether you want to see the calculated results on the home screen (Calculate) or on the graph screen (Draw). • Calculate calculates the test results and displays the outputs on the home screen. • Draw draws a graph of the test results and displays the test statistic and p-value with the graph. The window variables are adjusted automatically to fit the graph. To select Calculate or Draw, move the cursor to either Calculate or Draw, and then press Í. The instruction is immediately executed. Selecting Calculate for a Confidence Interval After you have entered all arguments in an inferential stat editor for a confidence interval, select Calculate to display the results. The Draw option is not available. When you press Í, Calculate calculates the confidence interval results and displays the outputs on the home screen. Bypassing the Inferential Stat Editors To paste a hypothesis test or confidence interval instruction to the home screen without displaying the corresponding inferential stat editor, select the instruction you want from the CATALOG menu. Appendix A describes the input syntax for each hypothesis test and confidence interval instruction. Note: You can paste a hypothesis test or confidence interval instruction to a command line in a program. From within the program editor, select the instruction from either the CATALOG (Chapter 15) or the STAT TESTS menu. Chapter 13: Inferential Statistics and Distributions 220
-
 1
1 -
2
-
3
-
4
-
5
-
6
-
7
-
8
-
9
-
10
-
11
-
12
-
13
-
14
-
15
-
16
-
17
-
18
-
19
-
20
-
21
-
22
-
23
-
24
-
25
-
26
-
27
-
28
-
29
-
30
-
31
-
32
-
33
-
34
-
35
-
36
-
37
-
38
-
39
-
40
-
41
-
42
-
43
-
44
-
45
-
46
-
47
-
48
-
49
-
50
-
51
-
52
-
53
-
54
-
55
-
56
-
57
-
58
-
59
-
60
-
61
-
62
-
63
-
64
-
65
-
66
-
67
-
68
-
69
-
70
-
71
-
72
-
73
-
74
-
75
-
76
-
77
-
78
-
79
-
80
-
81
-
82
-
83
-
84
-
85
-
86
-
87
-
88
-
89
-
90
-
91
-
92
-
93
-
94
-
95
-
96
-
97
-
98
-
99
-
100
-
101
-
102
-
103
-
104
-
105
-
106
-
107
-
108
-
109
-
110
-
111
-
112
-
113
-
114
-
115
-
116
-
117
-
118
-
119
-
120
-
121
-
122
-
123
-
124
-
125
-
126
-
127
-
128
-
129
-
130
-
131
-
132
-
133
-
134
-
135
-
136
-
137
-
138
-
139
-
140
-
141
-
142
-
143
-
144
-
145
-
146
-
147
-
148
-
149
-
150
-
151
-
152
-
153
-
154
-
155
-
156
-
157
-
158
-
159
-
160
-
161
-
162
-
163
-
164
-
165
-
166
-
167
-
168
-
169
-
170
-
171
-
172
-
173
-
174
-
175
-
176
-
177
-
178
-
179
-
180
-
181
-
182
-
183
-
184
-
185
-
186
-
187
-
188
-
189
-
190
-
191
-
192
-
193
-
194
-
195
-
196
-
197
-
198
-
199
-
200
-
201
-
202
-
203
-
204
-
205
-
206
-
207
-
208
-
209
-
210
-
211
-
212
-
213
-
214
-
215
-
216
-
217
-
218
-
219
-
220
-
221
-
 222
222 -
 223
223 -
 224
224 -
 225
225 -
 226
226 -
 227
227 -
 228
228 -
 229
229 -
 230
230 -
 231
231 -
 232
232 -
233
-
234
-
235
-
236
-
237
-
238
-
239
-
240
-
241
-
242
-
243
-
244
-
245
-
246
-
247
-
248
-
249
-
250
-
251
-
252
-
253
-
254
-
255
-
256
-
257
-
258
-
259
-
260
-
261
-
262
-
263
-
264
-
265
-
266
-
267
-
268
-
269
-
270
-
271
-
272
-
273
-
274
-
275
-
276
-
277
-
278
-
279
-
280
-
281
-
282
-
283
-
284
-
285
-
286
-
287
-
288
-
289
-
290
-
291
-
292
-
293
-
294
-
295
-
296
-
297
-
298
-
299
-
300
-
301
-
302
-
303
-
304
-
305
-
306
-
307
-
308
-
309
-
310
-
311
-
312
-
313
-
314
-
315
-
316
-
317
-
318
-
319
-
320
-
321
-
322
-
323
-
324
-
325
-
326
-
327
-
328
-
329
-
330
-
331
-
332
-
333
-
334
-
335
-
336
-
337
-
338
-
339
-
340
-
341
-
342
-
343
-
344
-
345
-
346
-
347
-
348
-
349
-
350
-
351
-
352
-
353
-
354
-
355
-
356
-
357
-
358
-
359
-
360
-
361
-
362
-
363
-
364
-
365
-
366
-
367
-
368
-
369
-
370
-
371
-
372
-
373
-
374
-
375
-
376
-
377
-
378
-
379
-
380
-
381
-
382
-
383
-
384
-
385
-
386
-
387
-
388
-
389
-
390
-
391
-
392
-
393
-
394
-
395
-
396
-
397
-
398
-
399
-
400
-
401
-
402
-
403
-
404
-
405
-
406
-
407
-
408
-
409
-
410
-
411
-
412
-
413
-
414
-
415
-
416
-
417
-
418
-
419
-
420
-
421
-
422
 |
 |
