Konica Minolta AccurioPress C2060 IC-314 User Guide - Page 41
appears above the color you have just scanned indicating
 |
View all Konica Minolta AccurioPress C2060 manuals
Add to My Manuals
Save this manual to your list of manuals |
Page 41 highlights
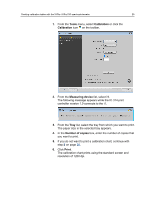
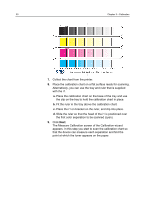
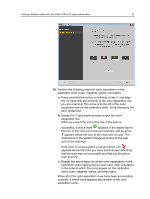
Creating calibration tables with the X-Rite i1/iSis/i1iO spectrophotometer 31 10. Perform the following steps for each separation on the calibration chart (cyan, magenta, yellow, and black). a. Press and hold the button on the side of the i1, and align the i1s head with the arrow tip of the color separation row you are scanning. The arrow is to the left of the color separation row on the calibration chart. Its tip intersects the semi-dotted line. b. Sweep the i1 spectrophotometer across the color separation row. When you reach the end of the row, if the scan is successful, a check mark appears in the wizard above the icon of the color you have just scanned, and an arrow appears below the icon of the next color to scan. The instructions in the wizard change according to the next color to be scanned. If the scan is not successful a red and white icon appears above the color you have just scanned indicating that the scan was not successful and that you should rescan that row. c. Repeat the above steps for all the color separations in the calibration chart making sure to scan each color separation in the order in which the icons appear on the calibration chart: cyan, magenta, yellow, and then black . When all of the color separation rows have been successfully scanned, a check mark appears above each of the color separation icons.
-
 1
1 -
2
-
3
-
4
-
5
-
6
-
7
-
8
-
9
-
10
-
11
-
12
-
13
-
14
-
15
-
16
-
17
-
18
-
19
-
20
-
21
-
22
-
23
-
24
-
25
-
26
-
27
-
28
-
29
-
30
-
31
-
32
-
33
-
34
-
35
-
 36
36 -
 37
37 -
 38
38 -
 39
39 -
 40
40 -
 41
41 -
 42
42 -
 43
43 -
 44
44 -
 45
45 -
 46
46 -
47
-
48
-
49
-
50
-
51
-
52
-
53
-
54
-
55
-
56
-
57
-
58
-
59
-
60
-
61
-
62
-
63
-
64
-
65
-
66
-
67
-
68
-
69
-
70
-
71
-
72
-
73
-
74
-
75
-
76
-
77
-
78
-
79
-
80
-
81
-
82
-
83
-
84
-
85
-
86
-
87
-
88
-
89
-
90
-
91
-
92
-
93
-
94
-
95
-
96
-
97
-
98
-
99
-
100
-
101
-
102
-
103
-
104
-
105
-
106
-
107
-
108
-
109
-
110
-
111
-
112
-
113
-
114
-
115
-
116
-
117
-
118
-
119
-
120
-
121
-
122
-
123
-
124
-
125
-
126
-
127
-
128
-
129
-
130
-
131
-
132
-
133
-
134
-
135
-
136
-
137
-
138
-
139
-
140
-
141
-
142
-
143
-
144
-
145
-
146
-
147
-
148
-
149
-
150
-
151
-
152
-
153
-
154
-
155
-
156
-
157
-
158
-
159
-
160
-
161
-
162
-
163
-
164
-
165
-
166
-
167
-
168
-
169
-
170
-
171
-
172
-
173
-
174
-
175
-
176
-
177
-
178
-
179
-
180
-
181
-
182
-
183
-
184
-
185
-
186
-
187
-
188
-
189
-
190
-
191
-
192
-
193
-
194
-
195
-
196
-
197
-
198
-
199
-
200
-
201
-
202
-
203
-
204
-
205
-
206
-
207
-
208
-
209
-
210
-
211
-
212
-
213
-
214
-
215
-
216
-
217
-
218
-
219
-
220
-
221
-
222
-
223
-
224
-
225
-
226
-
227
-
228
-
229
-
230
-
231
-
232
-
233
-
234
-
235
-
236
-
237
-
238
-
239
-
240
-
241
-
242
-
243
-
244
-
245
-
246
-
247
-
248
-
249
-
250
-
251
-
252
-
253
-
254
-
255
-
256
-
257
-
258
-
259
-
260
-
261
-
262
-
263
-
264
-
265
-
266
-
267
-
268
-
269
-
270
-
271
-
272
-
273
-
274
-
275
-
276
-
277
-
278
-
279
-
280
-
281
 |
 |
