Konica Minolta AccurioPress C2060 IC-314 User Guide - Page 99
Calibration, Linked, Number of copies, Print, Start, Save in, Create Profile, Profile Name
 |
View all Konica Minolta AccurioPress C2060 manuals
Add to My Manuals
Save this manual to your list of manuals |
Page 99 highlights
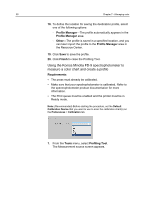
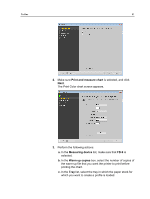
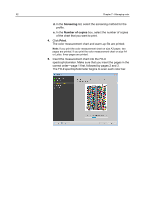
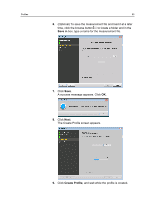
Profiles 89 e. In the Calibration list, select the relevant calibration table. Linked is the default setting (highly recommended). f. In the Number of copies box, select the number of copies of the chart that you want to print. 5. Click Print. A three-page color measurement chart and warm-up file are printed. 6. Place the first page of the chart on the i1iO scanning table and click Start. 7. Perform the following actions to find the coordinates of three points (top left, bottom left, and bottom right) in the color measurement chart: a. Use the visor to position the i1iO scanning table on the color patch marked in red. b. Use the i1 measurement button to confirm the position. The scanning process starts five seconds after the third coordinate is available. 8. Place the second page of the chart on the i1iO scanning table, and click Start. 9. Repeat step 7 on page 89 to measure the second page of the chart. 10. Place the third page of the chart on the i1iO scanning table, and click Start. 11. Repeat steps 7 on page 89 to measure the third page of the chart. 12. In the message that appears, click OK. 13. (Optional) To save the measurement file and load it at a later time, locate a folder and in the Save in box, type a name for the measurement file. 14. (Optional) Click Save. 15. Click Next. 16. Click Create Profile. This process might take a few minutes 17. In the Profile Name box, type a new name for the profile, or leave the name that the Profiling Tool automatically created based on the screening method.
-
 1
1 -
2
-
3
-
4
-
5
-
6
-
7
-
8
-
9
-
10
-
11
-
12
-
13
-
14
-
15
-
16
-
17
-
18
-
19
-
20
-
21
-
22
-
23
-
24
-
25
-
26
-
27
-
28
-
29
-
30
-
31
-
32
-
33
-
34
-
35
-
36
-
37
-
38
-
39
-
40
-
41
-
42
-
43
-
44
-
45
-
46
-
47
-
48
-
49
-
50
-
51
-
52
-
53
-
54
-
55
-
56
-
57
-
58
-
59
-
60
-
61
-
62
-
63
-
64
-
65
-
66
-
67
-
68
-
69
-
70
-
71
-
72
-
73
-
74
-
75
-
76
-
77
-
78
-
79
-
80
-
81
-
82
-
83
-
84
-
85
-
86
-
87
-
88
-
89
-
90
-
91
-
92
-
93
-
 94
94 -
 95
95 -
 96
96 -
 97
97 -
 98
98 -
 99
99 -
 100
100 -
 101
101 -
 102
102 -
 103
103 -
 104
104 -
105
-
106
-
107
-
108
-
109
-
110
-
111
-
112
-
113
-
114
-
115
-
116
-
117
-
118
-
119
-
120
-
121
-
122
-
123
-
124
-
125
-
126
-
127
-
128
-
129
-
130
-
131
-
132
-
133
-
134
-
135
-
136
-
137
-
138
-
139
-
140
-
141
-
142
-
143
-
144
-
145
-
146
-
147
-
148
-
149
-
150
-
151
-
152
-
153
-
154
-
155
-
156
-
157
-
158
-
159
-
160
-
161
-
162
-
163
-
164
-
165
-
166
-
167
-
168
-
169
-
170
-
171
-
172
-
173
-
174
-
175
-
176
-
177
-
178
-
179
-
180
-
181
-
182
-
183
-
184
-
185
-
186
-
187
-
188
-
189
-
190
-
191
-
192
-
193
-
194
-
195
-
196
-
197
-
198
-
199
-
200
-
201
-
202
-
203
-
204
-
205
-
206
-
207
-
208
-
209
-
210
-
211
-
212
-
213
-
214
-
215
-
216
-
217
-
218
-
219
-
220
-
221
-
222
-
223
-
224
-
225
-
226
-
227
-
228
-
229
-
230
-
231
-
232
-
233
-
234
-
235
-
236
-
237
-
238
-
239
-
240
-
241
-
242
-
243
-
244
-
245
-
246
-
247
-
248
-
249
-
250
-
251
-
252
-
253
-
254
-
255
-
256
-
257
-
258
-
259
-
260
-
261
-
262
-
263
-
264
-
265
-
266
-
267
-
268
-
269
-
270
-
271
-
272
-
273
-
274
-
275
-
276
-
277
-
278
-
279
-
280
-
281
 |
 |
