Canon CanoScan FS2700F User Manual - Page 66
How to Interpret the Tone Curve, Adjusting a Tone Curve, relationship between the input
 |
View all Canon CanoScan FS2700F manuals
Add to My Manuals
Save this manual to your list of manuals |
Page 66 highlights
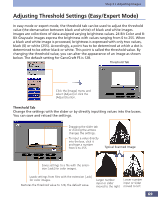
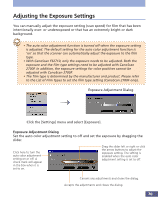
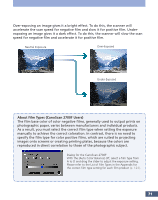
Step 3 • Adjusting Images How to Interpret the Tone Curve In CanoCraft FS, the data from the scanner is the input and the data sent to the display is the output. The tone curve expresses the relationship between the input and output values of the color tones, from shadows to highlights. Output Brightness Highlight Shadow Tone Curve Shadow Highlight Input Brightness Adjusting a Tone Curve The images below demonstrate how to adjust the brightness of an image by changing the tone curve. Tone Curve before Adjustment The input halftone data value is higher than the output highlights, making the image brighter in the display. Convex Curve Output Output Input Input The input halftone data value is higher than the output shadows, making the image darker in the display. Output * Make the curve shape as smooth as possible to provide a natural appearing effect. The changes in the settings will be reflected in the preview image, so check the preview image from time to time as you make changes. Concave Curve S Curve Output Input The input highlights and shadows are emphasized, providing the image with a sharp contrast. Input 66
-
 1
1 -
2
-
3
-
4
-
5
-
6
-
7
-
8
-
9
-
10
-
11
-
12
-
13
-
14
-
15
-
16
-
17
-
18
-
19
-
20
-
21
-
22
-
23
-
24
-
25
-
26
-
27
-
28
-
29
-
30
-
31
-
32
-
33
-
34
-
35
-
36
-
37
-
38
-
39
-
40
-
41
-
42
-
43
-
44
-
45
-
46
-
47
-
48
-
49
-
50
-
51
-
52
-
53
-
54
-
55
-
56
-
57
-
58
-
59
-
60
-
 61
61 -
 62
62 -
 63
63 -
 64
64 -
 65
65 -
 66
66 -
 67
67 -
 68
68 -
 69
69 -
 70
70 -
 71
71 -
72
-
73
-
74
-
75
-
76
-
77
-
78
-
79
-
80
-
81
-
82
-
83
-
84
-
85
-
86
-
87
-
88
-
89
-
90
-
91
-
92
-
93
-
94
-
95
-
96
-
97
-
98
-
99
-
100
-
101
-
102
-
103
-
104
-
105
-
106
-
107
-
108
-
109
-
110
-
111
-
112
-
113
-
114
-
115
-
116
-
117
-
118
-
119
-
120
-
121
-
122
-
123
-
124
-
125
-
126
-
127
-
128
-
129
-
130
-
131
-
132
-
133
-
134
-
135
 |
 |
