Casio EX-Z12 Owners Manual - Page 136
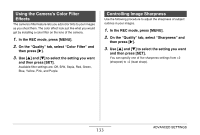
Using the On-screen Histogram to Check Exposure, How to Use the Histogram
 |
View all Casio EX-Z12 manuals
Add to My Manuals
Save this manual to your list of manuals |
Page 136 highlights
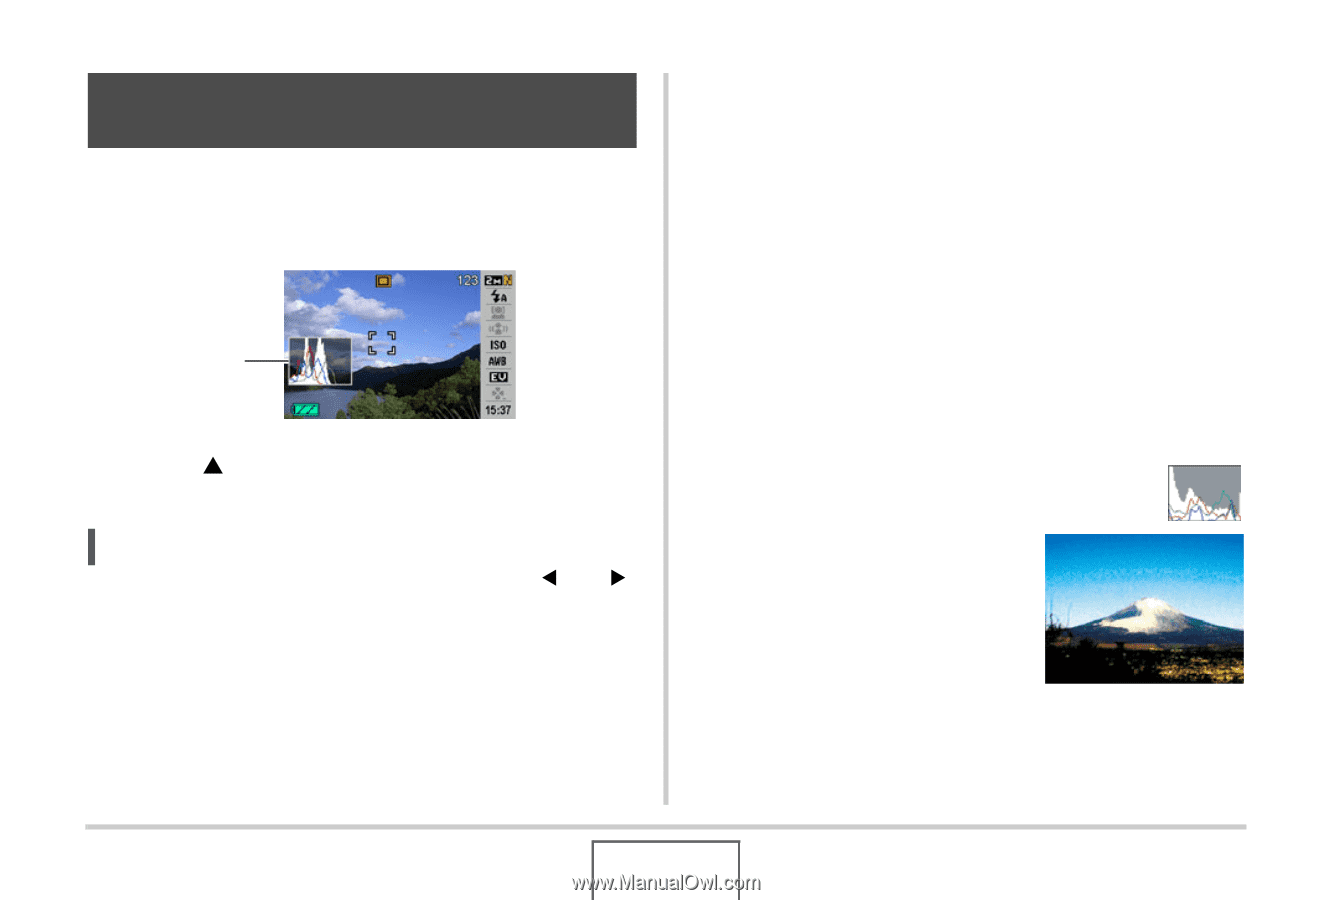
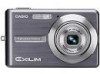
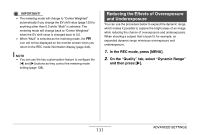
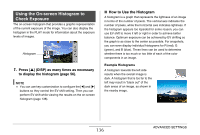
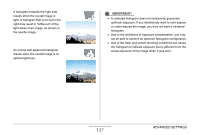
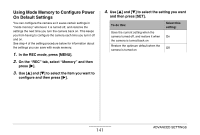
Using the On-screen Histogram to Check Exposure The on-screen histogram that provides a graphic representation of the current exposure of the image. You can also display the histogram in the PLAY mode for information about the exposure levels of images. Histogram 1. Press [S] (DISP) as many times as necessary to display the histogram (page 56). NOTE • You can use key customization to configure the [W] and [X] buttons so they control the EV shift setting. Then you can perform EV shift while viewing the results on the on-screen histogram (page 138). ■ How to Use the Histogram A histogram is a graph that represents the lightness of an image in terms of the number of pixels. The vertical axis indicates the number of pixels, while the horizontal axis indicates lightness. If the histogram appears too lopsided for some reason, you can use EV shift to move it left or right in order to achieve better balance. Optimum exposure can be achieved by EV shifting so the graph is as close to the center as possible. For snapshots, you can even display individual histograms for R (red), G (green), and B (blue). These lines can be used to determine whether there is too much or too little of each of the color components in an image. Example Histograms A histogram towards the left side results when the overall image is dark. A histogram that is too far to the left may result in "black out" of the dark areas of an image, as shown in the nearby image. 136 ADVANCED SETTINGS
-
 1
1 -
2
-
3
-
4
-
5
-
6
-
7
-
8
-
9
-
10
-
11
-
12
-
13
-
14
-
15
-
16
-
17
-
18
-
19
-
20
-
21
-
22
-
23
-
24
-
25
-
26
-
27
-
28
-
29
-
30
-
31
-
32
-
33
-
34
-
35
-
36
-
37
-
38
-
39
-
40
-
41
-
42
-
43
-
44
-
45
-
46
-
47
-
48
-
49
-
50
-
51
-
52
-
53
-
54
-
55
-
56
-
57
-
58
-
59
-
60
-
61
-
62
-
63
-
64
-
65
-
66
-
67
-
68
-
69
-
70
-
71
-
72
-
73
-
74
-
75
-
76
-
77
-
78
-
79
-
80
-
81
-
82
-
83
-
84
-
85
-
86
-
87
-
88
-
89
-
90
-
91
-
92
-
93
-
94
-
95
-
96
-
97
-
98
-
99
-
100
-
101
-
102
-
103
-
104
-
105
-
106
-
107
-
108
-
109
-
110
-
111
-
112
-
113
-
114
-
115
-
116
-
117
-
118
-
119
-
120
-
121
-
122
-
123
-
124
-
125
-
126
-
127
-
128
-
129
-
130
-
 131
131 -
 132
132 -
 133
133 -
 134
134 -
 135
135 -
 136
136 -
 137
137 -
 138
138 -
 139
139 -
 140
140 -
 141
141 -
142
-
143
-
144
-
145
-
146
-
147
-
148
-
149
-
150
-
151
-
152
-
153
-
154
-
155
-
156
-
157
-
158
-
159
-
160
-
161
-
162
-
163
-
164
-
165
-
166
-
167
-
168
-
169
-
170
-
171
-
172
-
173
-
174
-
175
-
176
-
177
-
178
-
179
-
180
-
181
-
182
-
183
-
184
-
185
-
186
-
187
-
188
-
189
-
190
-
191
-
192
-
193
-
194
-
195
-
196
-
197
-
198
-
199
-
200
-
201
-
202
-
203
-
204
-
205
-
206
-
207
-
208
-
209
-
210
-
211
-
212
-
213
-
214
-
215
-
216
-
217
-
218
-
219
-
220
-
221
-
222
-
223
-
224
-
225
-
226
-
227
-
228
-
229
-
230
-
231
-
232
-
233
-
234
-
235
-
236
-
237
-
238
-
239
-
240
-
241
-
242
-
243
-
244
-
245
-
246
-
247
-
248
-
249
-
250
-
251
-
252
-
253
-
254
-
255
-
256
-
257
-
258
-
259
-
260
-
261
-
262
-
263
-
264
-
265
 |
 |