HP P4000 9.0 HP StorageWorks P4000 SAN Solution User Guide - Page 123
Working with alarms, Filtering the alarms list
 |
View all HP P4000 manuals
Add to My Manuals
Save this manual to your list of manuals |
Page 123 highlights
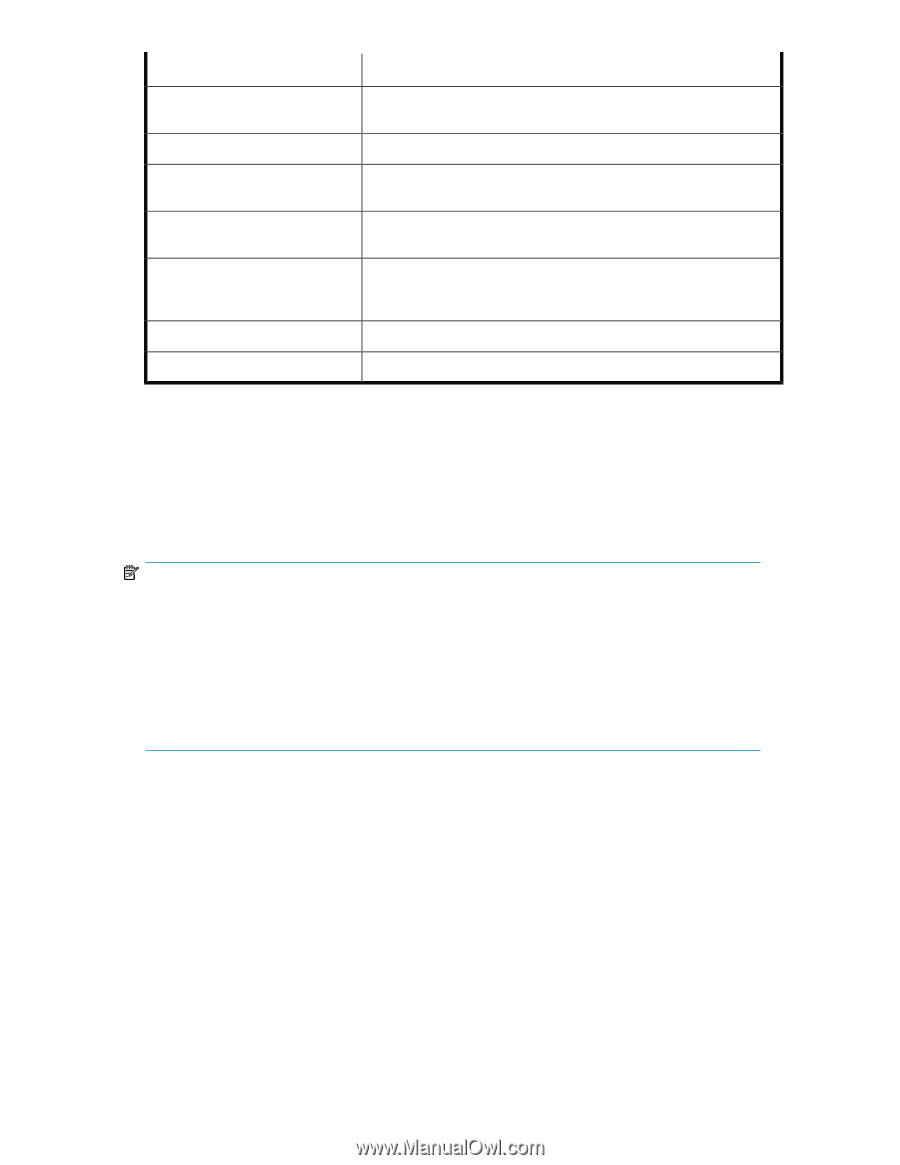
Column Type Name Component Cluster Management Group Hostname Source Description Specific type of device or object the event is related to, such as, volume, storage system, disk, manager, and so forth. Name of the device or object the event is related to. Major category of the device or object the event is related to, typically, hardware, SAN/iQ, or system (software). Name of the cluster where the event occurred. If blank, the cluster name was not known when the event occurred. Name of management group where the event occurred. If blank, the management group name was not known when the event occurred. (Only appears in the Alarms window.) Name of the storage system that posted the event. User that generated the event, such as system (software) or a user name. Working with alarms The Alarms window is always visible at the bottom of the CMC and displays all warning and critical events for all management groups you are logged in to. Use the column headings to sort the list of alarms. Double-click an alarm to see more details. For definitions of the event types and columns, see "Alarms and events overview" on page 121. NOTE: You should review alarms regularly, especially the critical ones, and take the appropriate action to resolve the alarm. Alarms stay in the Alarms window until the situation is resolved. A warning or critical icon also appears in the navigation window tree next to the item that had the warning or critical event. If you have a mix of SAN/iQ versions installed in a management group that includes versions earlier than 9.0, you will also see an Alerts tab. Only the Alerts tab will display alarms and events for the for the management group. When all storage systems are upgraded to 9.0 or later, the Events node and Alarms tab will reflect all alarms and events. You can do the following with alarms: • Filter the list • Display details • Display in a separate window • Export to a .csv file Filtering the alarms list You can filter the alarms listed in the Alarms window based on text in any column. To filter the alarms list: 1. In the navigation window, log in to the management group. P4000 SAN Solution user guide 123
-
 1
1 -
2
-
3
-
4
-
5
-
6
-
7
-
8
-
9
-
10
-
11
-
12
-
13
-
14
-
15
-
16
-
17
-
18
-
19
-
20
-
21
-
22
-
23
-
24
-
25
-
26
-
27
-
28
-
29
-
30
-
31
-
32
-
33
-
34
-
35
-
36
-
37
-
38
-
39
-
40
-
41
-
42
-
43
-
44
-
45
-
46
-
47
-
48
-
49
-
50
-
51
-
52
-
53
-
54
-
55
-
56
-
57
-
58
-
59
-
60
-
61
-
62
-
63
-
64
-
65
-
66
-
67
-
68
-
69
-
70
-
71
-
72
-
73
-
74
-
75
-
76
-
77
-
78
-
79
-
80
-
81
-
82
-
83
-
84
-
85
-
86
-
87
-
88
-
89
-
90
-
91
-
92
-
93
-
94
-
95
-
96
-
97
-
98
-
99
-
100
-
101
-
102
-
103
-
104
-
105
-
106
-
107
-
108
-
109
-
110
-
111
-
112
-
113
-
114
-
115
-
116
-
117
-
 118
118 -
 119
119 -
 120
120 -
 121
121 -
 122
122 -
 123
123 -
 124
124 -
 125
125 -
 126
126 -
 127
127 -
 128
128 -
129
-
130
-
131
-
132
-
133
-
134
-
135
-
136
-
137
-
138
-
139
-
140
-
141
-
142
-
143
-
144
-
145
-
146
-
147
-
148
-
149
-
150
-
151
-
152
-
153
-
154
-
155
-
156
-
157
-
158
-
159
-
160
-
161
-
162
-
163
-
164
-
165
-
166
-
167
-
168
-
169
-
170
-
171
-
172
-
173
-
174
-
175
-
176
-
177
-
178
-
179
-
180
-
181
-
182
-
183
-
184
-
185
-
186
-
187
-
188
-
189
-
190
-
191
-
192
-
193
-
194
-
195
-
196
-
197
-
198
-
199
-
200
-
201
-
202
-
203
-
204
-
205
-
206
-
207
-
208
-
209
-
210
-
211
-
212
-
213
-
214
-
215
-
216
-
217
-
218
-
219
-
220
-
221
-
222
-
223
-
224
-
225
-
226
-
227
-
228
-
229
-
230
-
231
-
232
-
233
-
234
-
235
-
236
-
237
-
238
-
239
-
240
-
241
-
242
-
243
-
244
-
245
-
246
-
247
-
248
-
249
-
250
-
251
-
252
-
253
-
254
-
255
-
256
-
257
-
258
-
259
-
260
-
261
-
262
-
263
-
264
-
265
-
266
-
267
-
268
-
269
-
270
-
271
-
272
-
273
-
274
-
275
-
276
-
277
-
278
-
279
-
280
-
281
-
282
-
283
-
284
-
285
-
286
-
287
-
288
-
289
-
290
-
291
-
292
-
293
-
294
-
295
-
296
-
297
-
298
-
299
-
300
-
301
-
302
-
303
-
304
-
305
-
306
-
307
-
308
-
309
-
310
-
311
-
312
-
313
-
314
-
315
-
316
-
317
-
318
-
319
-
320
-
321
-
322
-
323
-
324
-
325
-
326
-
327
-
328
-
329
-
330
-
331
-
332
-
333
-
334
-
335
-
336
-
337
-
338
-
339
-
340
-
341
-
342
-
343
-
344
-
345
-
346
-
347
-
348
-
349
-
350
 |
 |