HP P4000 9.0 HP StorageWorks P4000 SAN Solution User Guide - Page 278
Understanding the performance statistics, Table 61, Adding statistics
 |
View all HP P4000 manuals
Add to My Manuals
Save this manual to your list of manuals |
Page 278 highlights
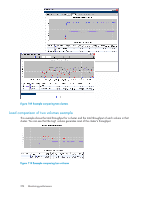
Table 61 on page 278 defines each column of the Performance Monitor table. Table 61 Performance Monitor table columns Column Display Line Name Server Statistic Units Value Minimum Maximum Average Scale Definition Check box where you toggle the display of the graph line on or off. Shows the current color and style for the statistic's line on the graph. Name of the cluster, storage system, or volume being monitored. For volumes and snapshots, the server that has access. The statistic you selected for monitoring. Unit of measure for the statistic. Current sample value for the statistic. Lowest recorded sample value of the last 100 samples. Highest recorded sample value of the last 100 samples. Average of the last 100 recorded sample values. Scaling factor used to fit the data on the graph's 0 to 100 scale. Only the line on the graph is scaled; the values in the table are not scaled. The values in the log file, if you export the file, are also not scaled. For information about adding statistics, see "Adding statistics" on page 282. Understanding the performance statistics You can select the performance statistics that you want to monitor. For clusters, volumes, and snapshots, the statistics being reported are based on client IO. This is the iSCSI traffic and does not include other traffic such as replication, remote snapshots, and management functions. For storage systems and devices, the statistics report the total traffic, including iSCSI traffic along with replication, remote snapshots, and management functions. The difference between what the cluster, volumes, and snapshots are reporting and what the storage systems and devices are reporting is the overhead (replication, remote snapshots, and management functions). 278 Monitoring performance
-
 1
1 -
2
-
3
-
4
-
5
-
6
-
7
-
8
-
9
-
10
-
11
-
12
-
13
-
14
-
15
-
16
-
17
-
18
-
19
-
20
-
21
-
22
-
23
-
24
-
25
-
26
-
27
-
28
-
29
-
30
-
31
-
32
-
33
-
34
-
35
-
36
-
37
-
38
-
39
-
40
-
41
-
42
-
43
-
44
-
45
-
46
-
47
-
48
-
49
-
50
-
51
-
52
-
53
-
54
-
55
-
56
-
57
-
58
-
59
-
60
-
61
-
62
-
63
-
64
-
65
-
66
-
67
-
68
-
69
-
70
-
71
-
72
-
73
-
74
-
75
-
76
-
77
-
78
-
79
-
80
-
81
-
82
-
83
-
84
-
85
-
86
-
87
-
88
-
89
-
90
-
91
-
92
-
93
-
94
-
95
-
96
-
97
-
98
-
99
-
100
-
101
-
102
-
103
-
104
-
105
-
106
-
107
-
108
-
109
-
110
-
111
-
112
-
113
-
114
-
115
-
116
-
117
-
118
-
119
-
120
-
121
-
122
-
123
-
124
-
125
-
126
-
127
-
128
-
129
-
130
-
131
-
132
-
133
-
134
-
135
-
136
-
137
-
138
-
139
-
140
-
141
-
142
-
143
-
144
-
145
-
146
-
147
-
148
-
149
-
150
-
151
-
152
-
153
-
154
-
155
-
156
-
157
-
158
-
159
-
160
-
161
-
162
-
163
-
164
-
165
-
166
-
167
-
168
-
169
-
170
-
171
-
172
-
173
-
174
-
175
-
176
-
177
-
178
-
179
-
180
-
181
-
182
-
183
-
184
-
185
-
186
-
187
-
188
-
189
-
190
-
191
-
192
-
193
-
194
-
195
-
196
-
197
-
198
-
199
-
200
-
201
-
202
-
203
-
204
-
205
-
206
-
207
-
208
-
209
-
210
-
211
-
212
-
213
-
214
-
215
-
216
-
217
-
218
-
219
-
220
-
221
-
222
-
223
-
224
-
225
-
226
-
227
-
228
-
229
-
230
-
231
-
232
-
233
-
234
-
235
-
236
-
237
-
238
-
239
-
240
-
241
-
242
-
243
-
244
-
245
-
246
-
247
-
248
-
249
-
250
-
251
-
252
-
253
-
254
-
255
-
256
-
257
-
258
-
259
-
260
-
261
-
262
-
263
-
264
-
265
-
266
-
267
-
268
-
269
-
270
-
271
-
272
-
 273
273 -
 274
274 -
 275
275 -
 276
276 -
 277
277 -
 278
278 -
 279
279 -
 280
280 -
 281
281 -
 282
282 -
 283
283 -
284
-
285
-
286
-
287
-
288
-
289
-
290
-
291
-
292
-
293
-
294
-
295
-
296
-
297
-
298
-
299
-
300
-
301
-
302
-
303
-
304
-
305
-
306
-
307
-
308
-
309
-
310
-
311
-
312
-
313
-
314
-
315
-
316
-
317
-
318
-
319
-
320
-
321
-
322
-
323
-
324
-
325
-
326
-
327
-
328
-
329
-
330
-
331
-
332
-
333
-
334
-
335
-
336
-
337
-
338
-
339
-
340
-
341
-
342
-
343
-
344
-
345
-
346
-
347
-
348
-
349
-
350
 |
 |
